

Truro and nearby towns · January–October 2026
By November, the light across the Pamet Valley sits lower and a walk along Truro’s Atlantic shore calls for another layer. For an owner weighing a sale now or preparing for spring, this is a useful time to plan repairs, photography and pricing around the property’s setting and the way it lives as colder weather approaches.

The town’s first ten months of 2026 offer a useful reminder that activity and prices can move in different directions. More residential sales closed than a year earlier, even as the median sale price moved lower. By October, the active-listing count was also higher than last year.
For sellers, that combination calls for a close look at the homes that actually changed hands and the alternatives available now. The broad numbers help frame the conversation. The setting, condition and character of your home determine which comparisons belong in it.
More closings, a different mix of homes
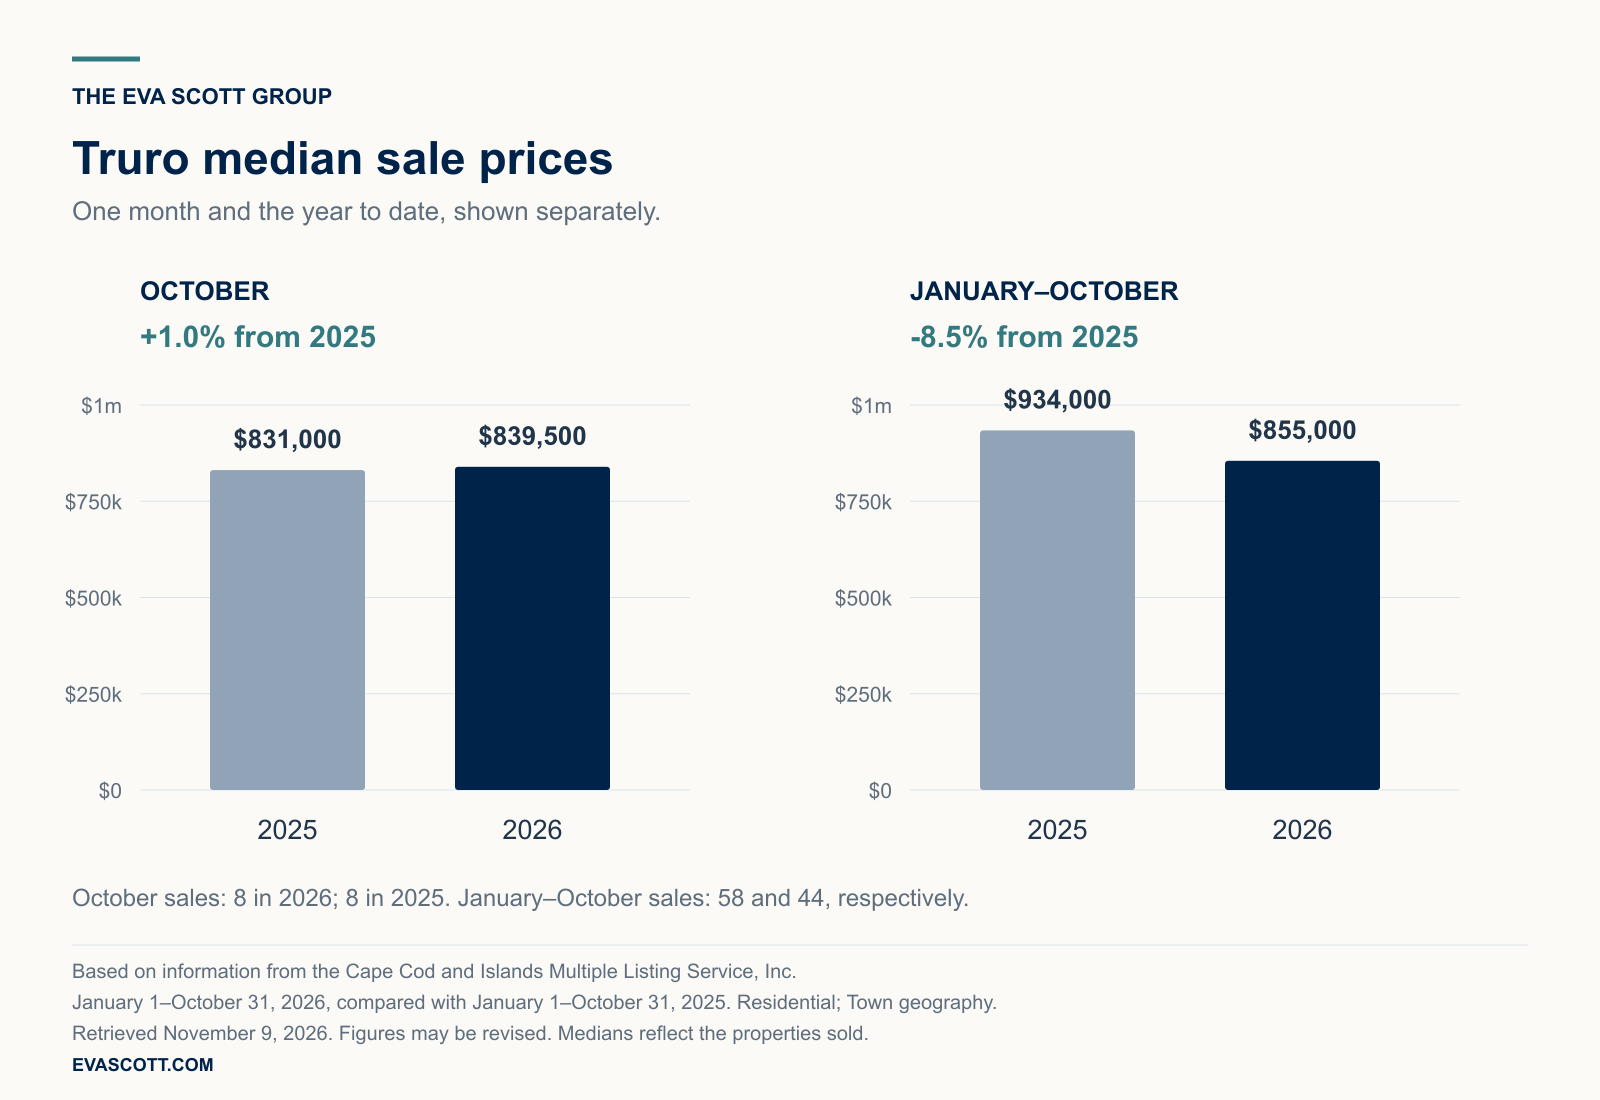
Truro recorded 58 residential sales from January through October, compared with 44 in 2025. That is a 31.8% increase, representing 14 additional sales. The reported median sale price fell 8.5%, from $934,000 to $855,000.
October itself was steady on completed sales: eight homes closed in each year. The October median was $839,500 in 2026, compared with $831,000 in 2025, an increase of 1.0%. The month’s small gain sits within a lower ten-month median.
Those figures do not establish that a particular Truro home gained or lost the same percentage in value. With eight sales in October, a few different properties can change the middle of the group. Even the larger year-to-date sample includes homes with very different locations, sizes and features.
If you are considering a sale, begin with recent transactions that resemble your property. A broad town median cannot resolve the difference between a cottage, a contemporary home in the trees and a property with a water view. Those details need to be part of the pricing discussion from the beginning.
Select any chart to view it at full size.
The surrounding towns tell different stories
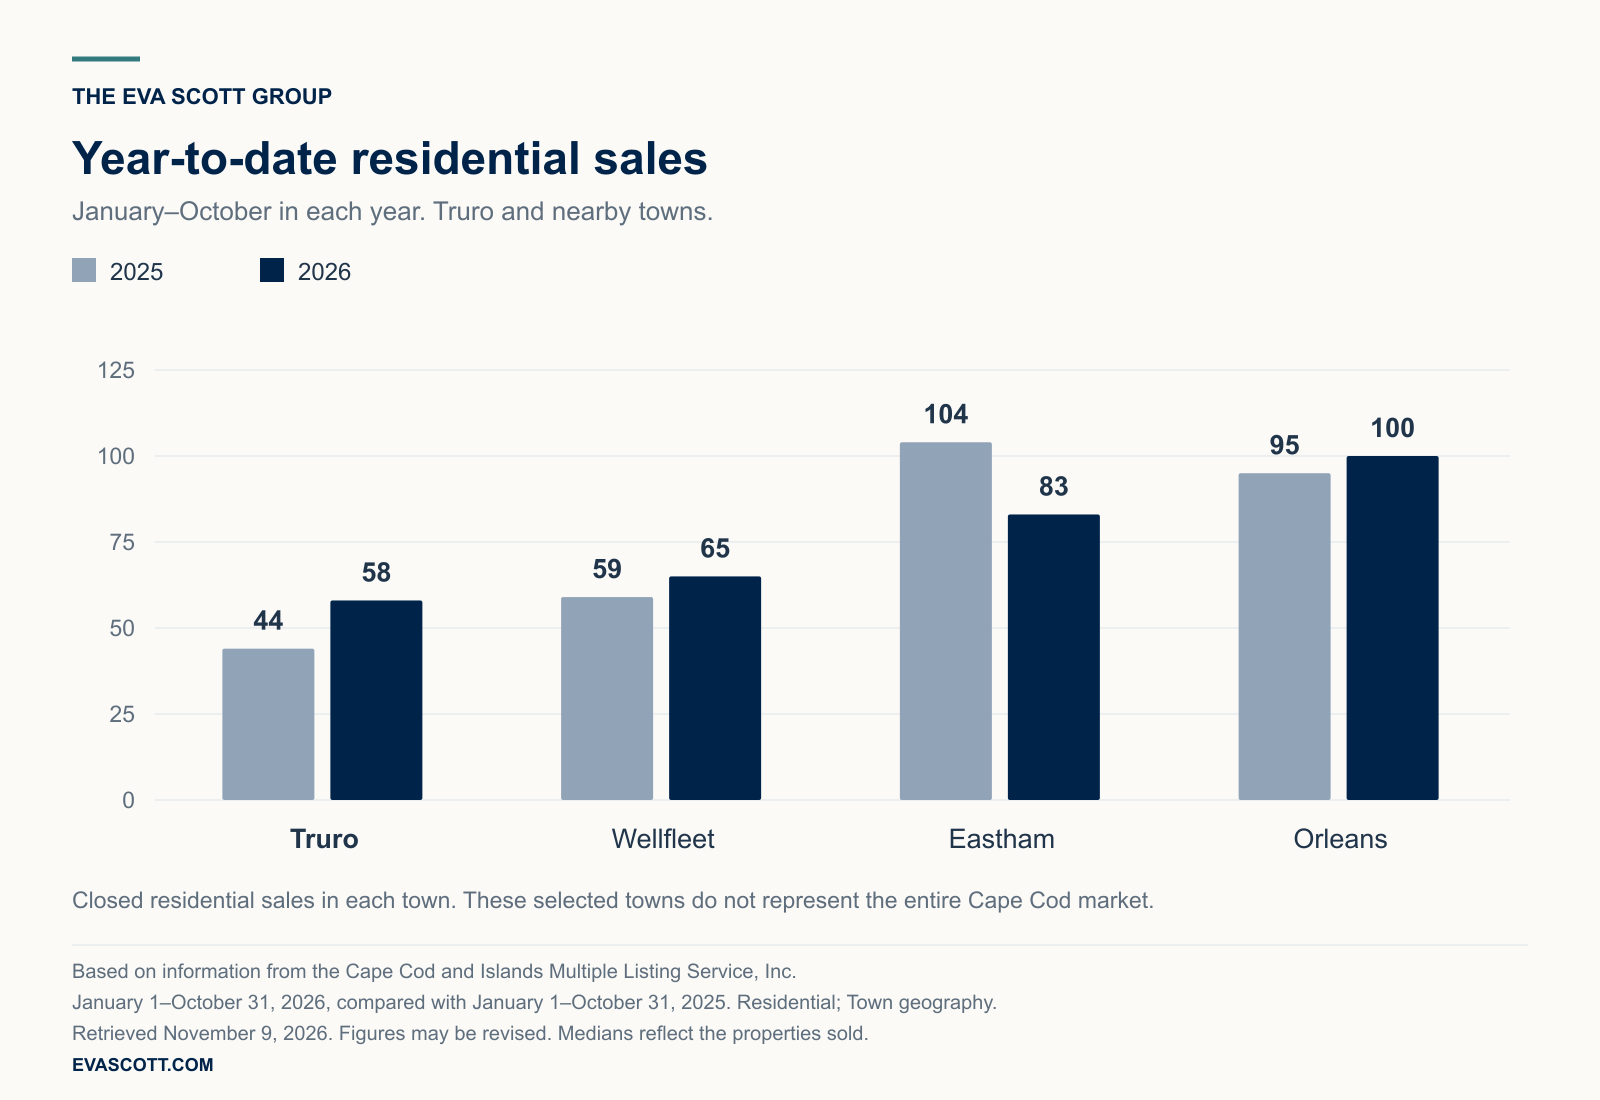
Looking at Wellfleet, Eastham and Orleans gives Truro’s results a wider setting. Wellfleet rose from 59 year-to-date sales to 65, and Orleans rose from 95 to 100. Eastham moved the other way, from 104 sales to 83.
Truro’s 31.8% increase was the largest percentage gain among these four towns. The starting count matters: moving from 44 sales to 58 produces a large percentage from 14 additional transactions. That is useful context before turning the headline into a claim about demand for every kind of Truro home.
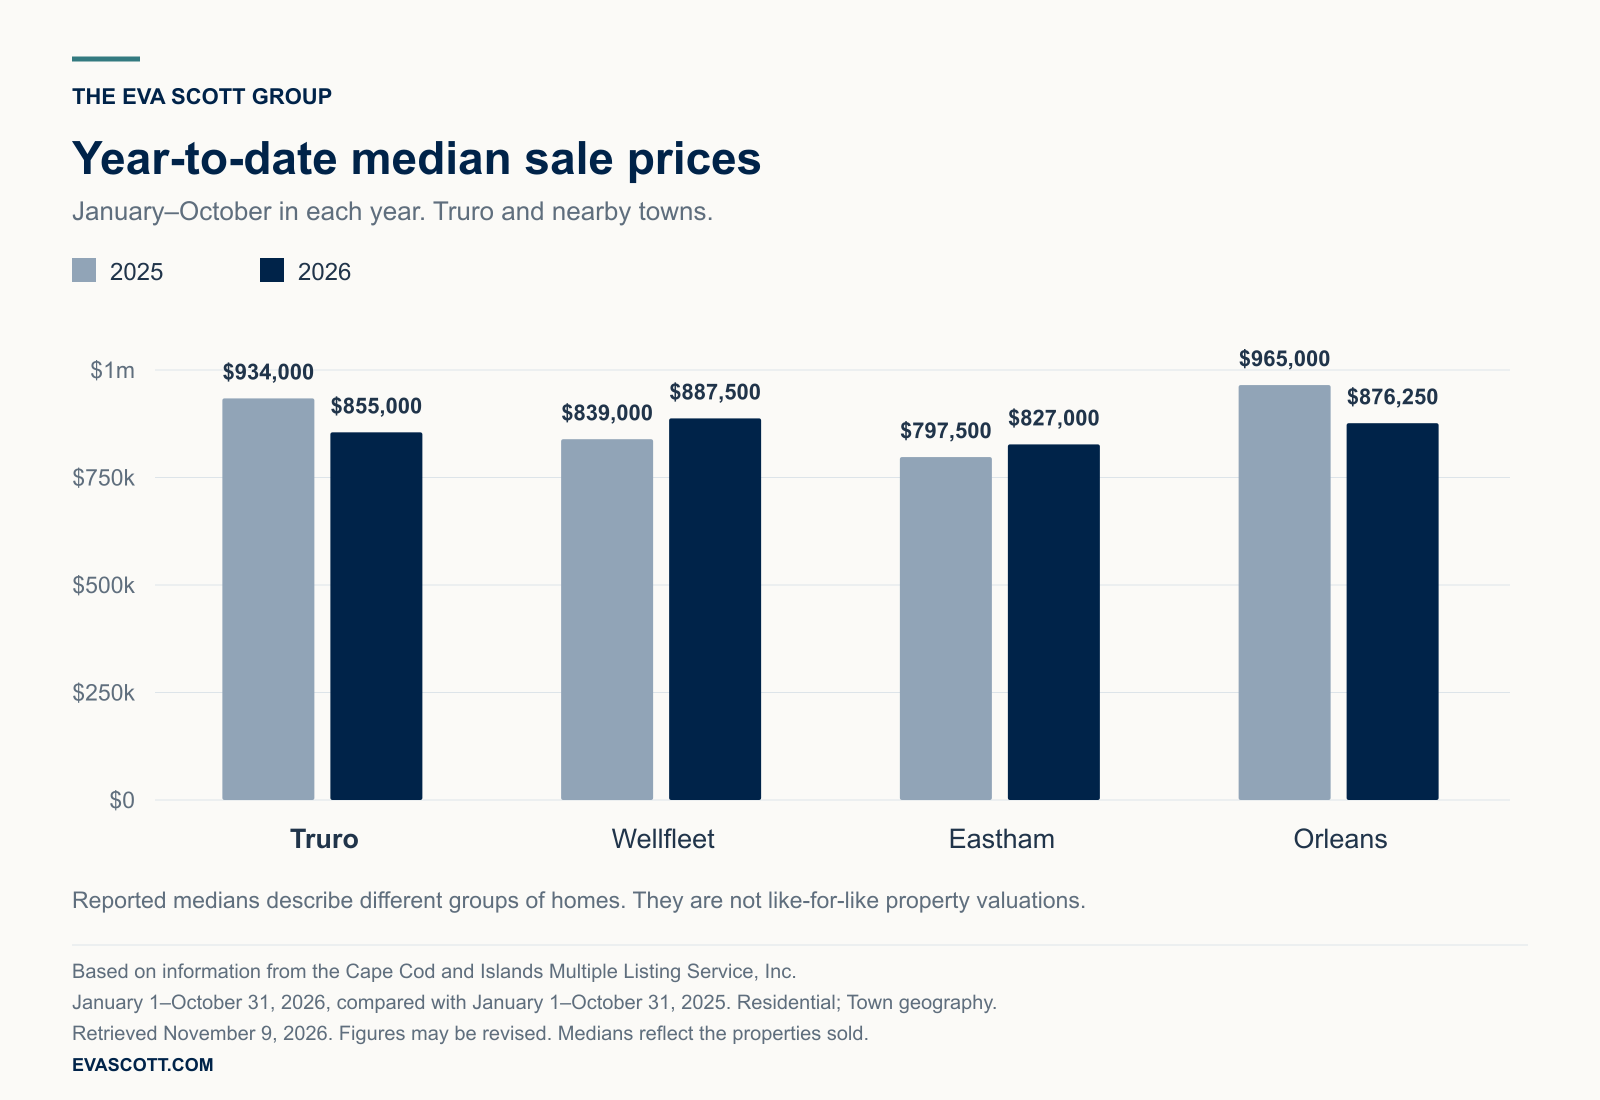
The median-price comparisons are just as varied. Wellfleet’s year-to-date median rose 5.8% to $887,500, and Eastham’s rose 3.7% to $827,000. Orleans’ fell 9.2% to $876,250. Truro’s $855,000 median reflected its own group of completed sales.
A seller can use that regional view to ask better questions about positioning. Which specific homes might a buyer compare across town lines? How do the location, condition and features line up with your asking price? A lower median somewhere else is not evidence that an equivalent home is available for that amount.

The inventory story, in two years
Truro’s inventory did not follow a simple summer peak and autumn decline in 2026. The active count started at 28 in January, dipped to 24 in March and reached 48 in May. It later eased to 42 in August before rising to 50 in October, the highest 2026 count shown in this ten-month comparison.
The 2025 line started at 22 in January and reached its highest count shown, 46, in August. October 2025 had 45 active listings, compared with 50 this year. That means five more active listings in the town-wide October snapshot.
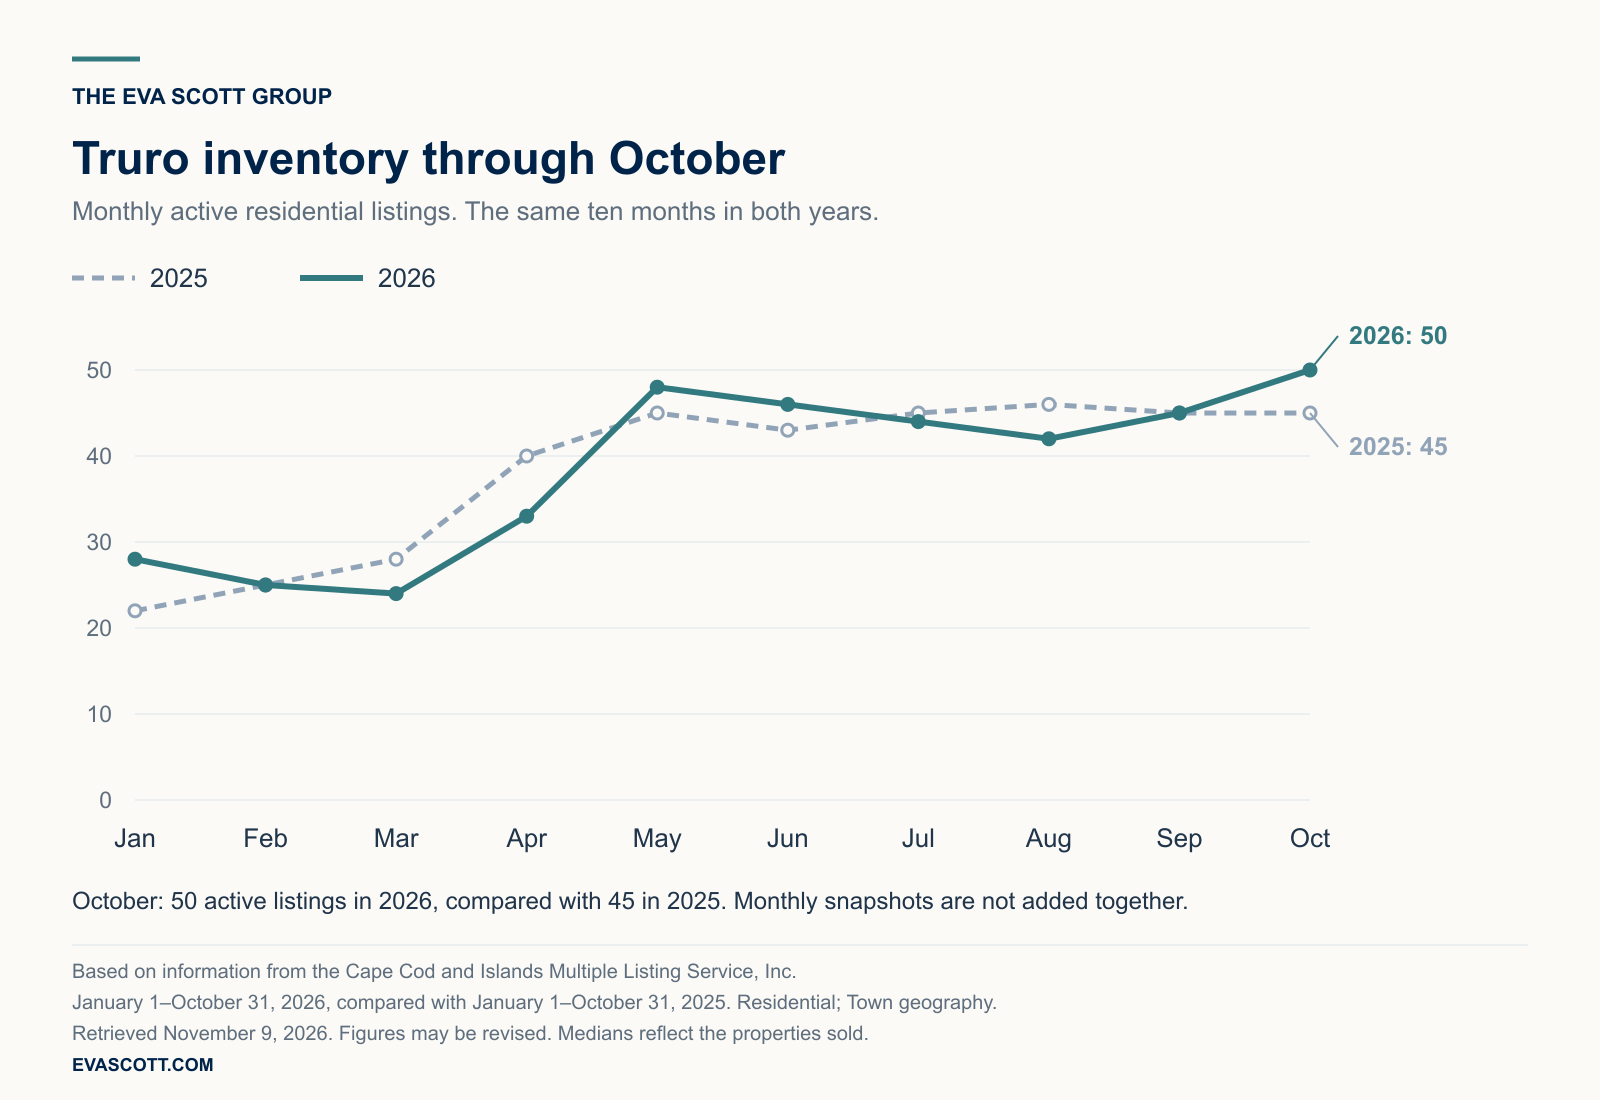
For an owner choosing when to launch, this is a reason to check current competition close to the actual listing date. A calendar-based assumption about a quieter fall would miss the late rise shown here. The properties in your price range and location matter more than the town-wide total alone.
Make the property’s story easy to understand
Think about what a buyer should understand before the first showing: the home’s layout, its relationship to the land and the details that make the setting distinctive. Thoughtful photography and a clear description can introduce that story. Preparation helps the experience at the property match what the marketing promised.
A selling plan should also allow room to review the response after launch. The right starting point is a price grounded in relevant sales, a clear view of competing listings and a preparation schedule that fits your next move. The town’s higher sales count is context for that work, rather than a substitute for it.
If a sale is on your horizon, talk with The Eva Scott Group about your Truro home. We can review the most relevant sales and current listings with you, then build a pricing, preparation and marketing plan around your property and your next move.
Based on information from the Cape Cod and Islands Multiple Listing Service, Inc. for January 1 through October 31, 2026, with comparisons to January 1 through October 31, 2025. October-only figures cover October 1–31 in each year. Information is deemed reliable but is not guaranteed and may be revised. These are aggregate market statistics, not an appraisal or an estimate of any individual home’s value.
Sources and scope: CCIMLS flexmls Market Summary reports and exports retrieved November 9, 2026. All town reports use the Residential property type and Town geography, with “Include Comp Sale Listings” unchecked. Year-to-date means January–October in each year; 2026 is not a completed full year. Monthly inventory observations are active-listing snapshots and are not added together. Medians are reported separately for each town and period, not averaged from monthly or town medians. Changes in medians reflect the properties sold, not repeat sales of identical homes. Photography by Nauset Media, reused from the site’s Truro guide.


