

Wellfleet and nearby towns · January–October 2026
In Wellfleet, shorter days bring a different light to the harbor and dunes, with stunning sunsets over Blackfish Creek as the marsh turns golden. If selling is on your mind this fall, it is a good moment to look at your home with fresh eyes: how it feels on a cool afternoon, what needs attention before winter, and where a thoughtful asking price fits the market through October.

For an owner weighing a sale, the question is personal: where does my home fit? A cottage, a village home and a larger waterfront property can share a Wellfleet address while calling for very different pricing comparisons and ways of presenting the property.
This year’s numbers give that conversation a starting point. October brought fewer closings, yet Wellfleet’s first ten months were ahead of last year. Nearby towns followed different paths, and fall inventory ended up close to 2025. For sellers, the story is in how those pieces fit together around their own home.
Start your pricing conversation with the year
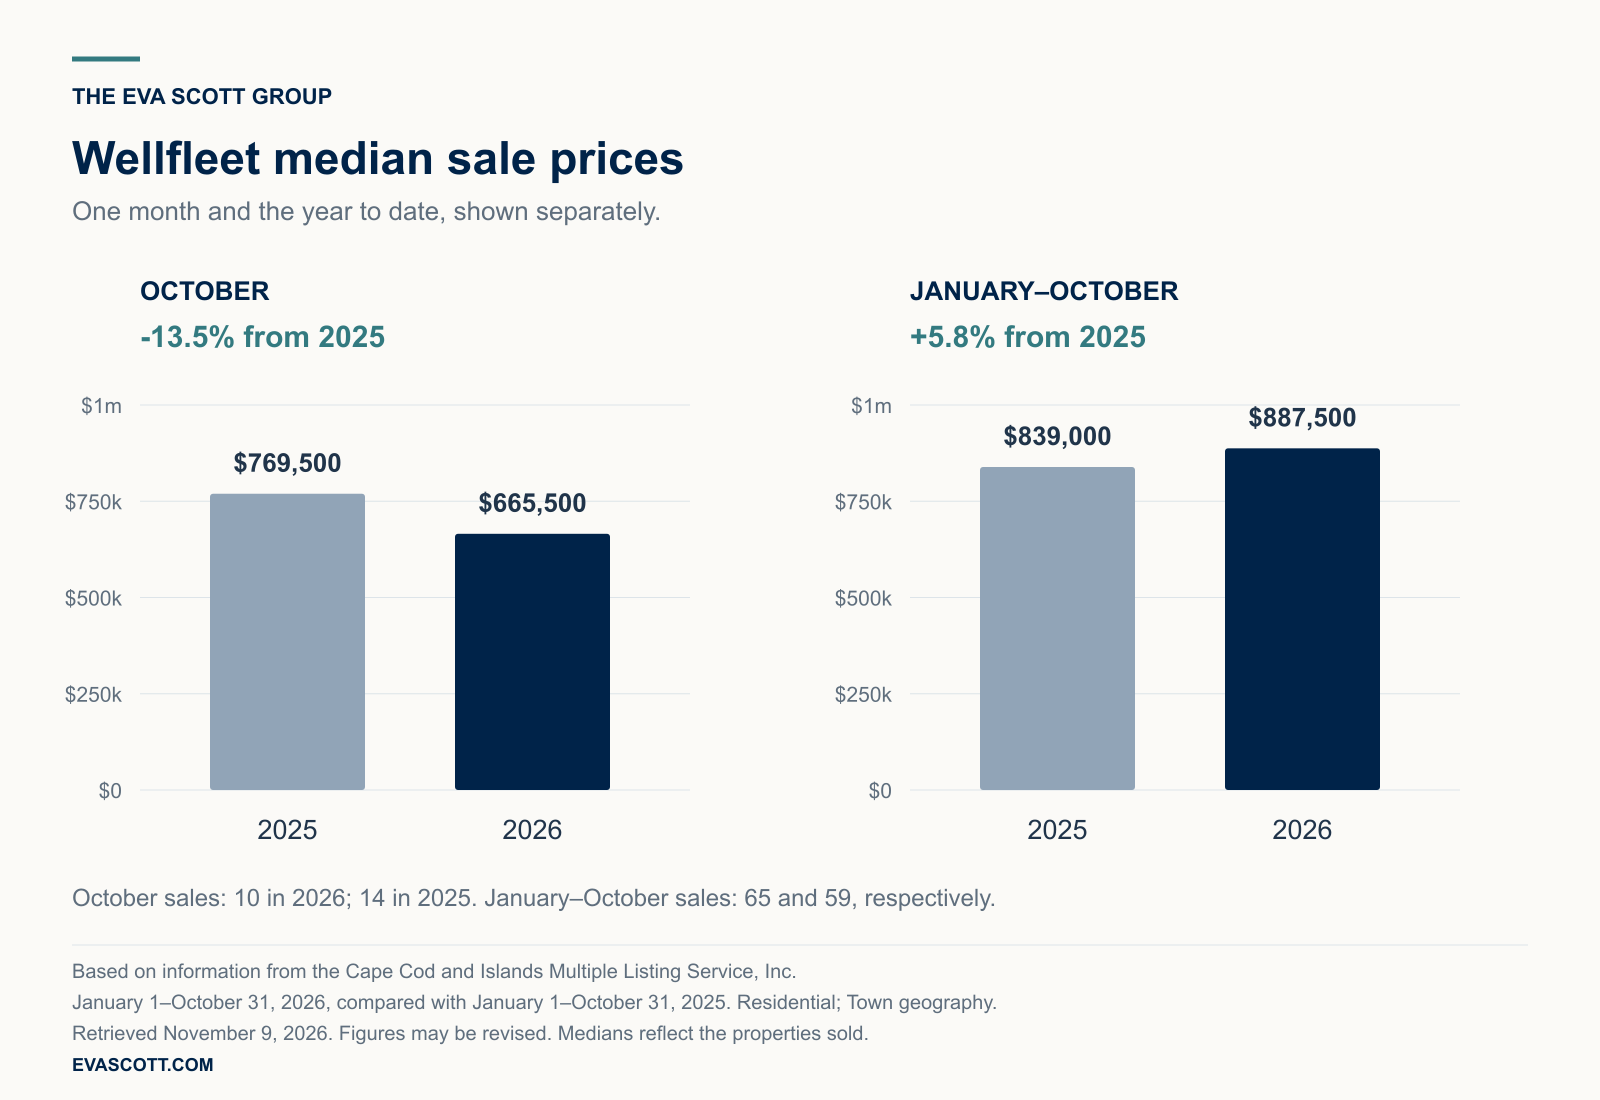
From January through October, Wellfleet recorded 65 residential sales, compared with 59 in 2025, an increase of 10.2%. The reported median sale price rose 5.8%, from $839,000 to $887,500. That gives us a broader starting point than any one month.
October on its own looked quieter: ten sales closed, compared with 14 a year earlier. Its median sale price was $665,500, down from $769,500. Four of those ten sales were below $500,000, a reminder that a small month can be shaped by the particular properties that happen to close.
If you are setting an asking price, neither October’s decline nor the year’s increase translates directly into a change in your home’s value. The town median describes the middle of a group of transactions. Your pricing conversation needs the recent sales closest to your property in setting, condition, size and character.
Select any chart to view it at full size.
A short drive changes the picture
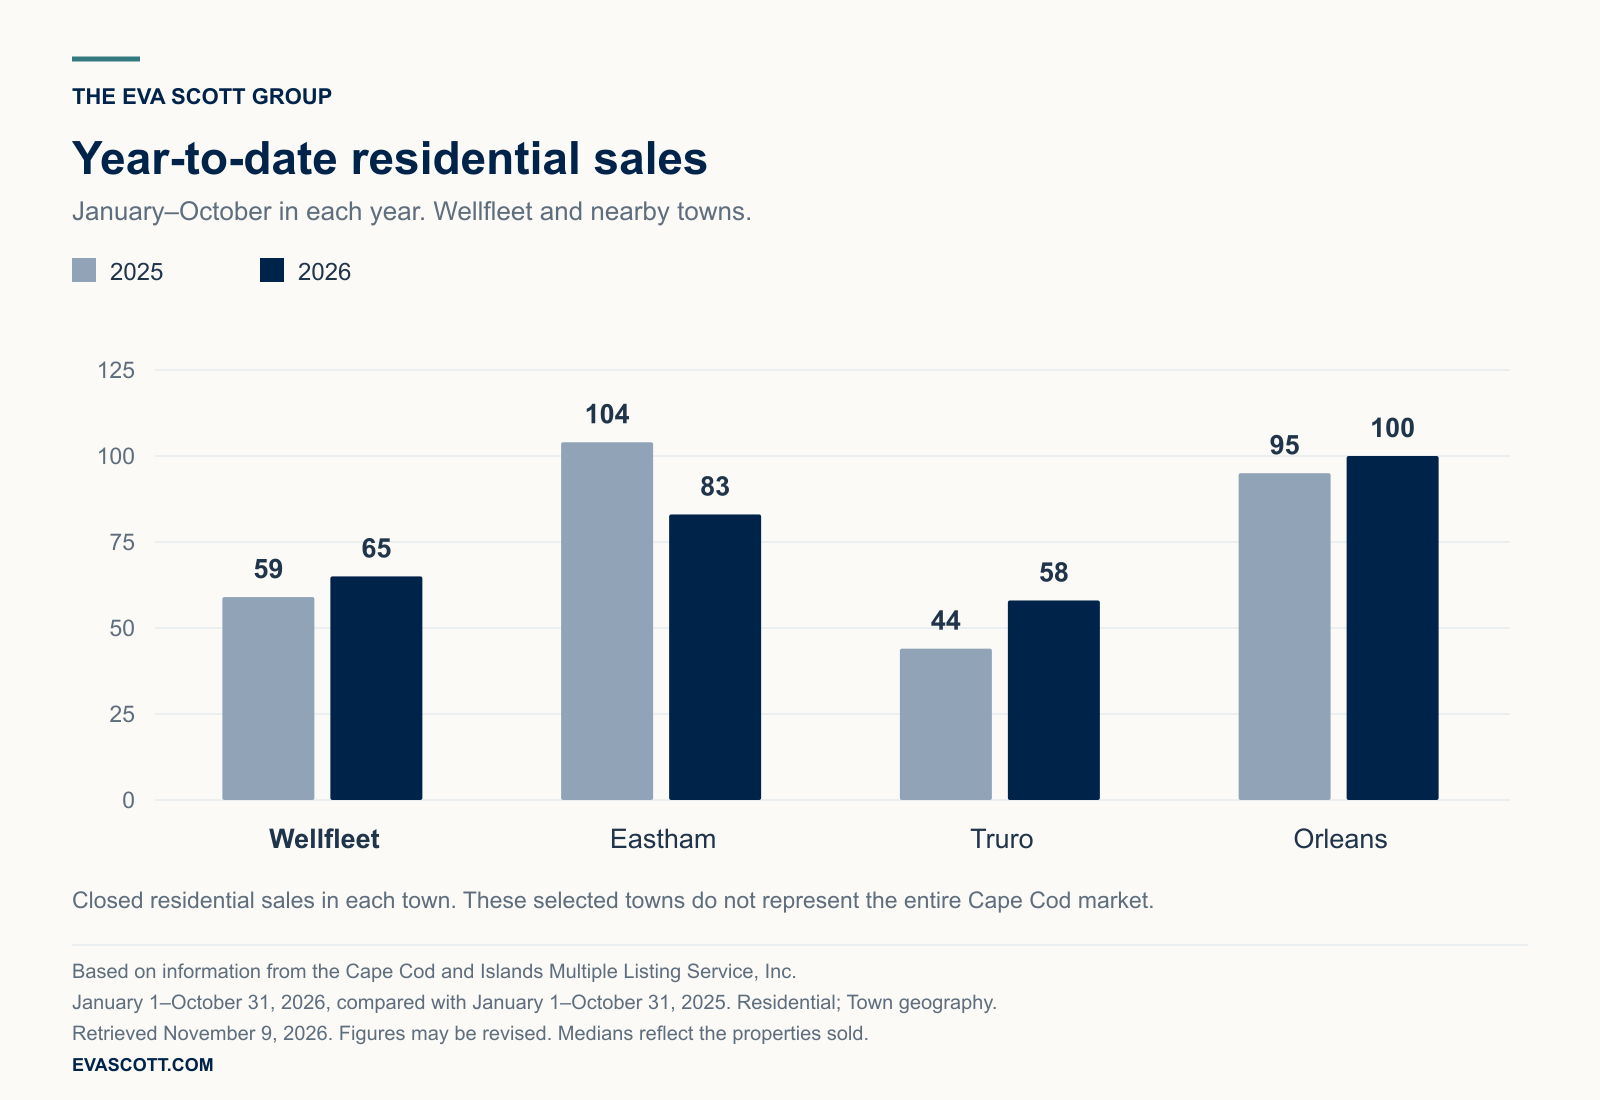
Selling in Wellfleet also means understanding the market around it. Looking at Eastham, Truro and Orleans adds context to the choices a buyer may be considering. Together, these four towns recorded 306 closed sales through October, versus 302 last year—a modest increase of 1.3%. Within that relatively steady total, the local differences are much more pronounced.
Wellfleet and Orleans were ahead on year-to-date closings. Truro rose from 44 sales to 58, while Eastham fell from 104 to 83. Truro’s 31.8% gain is a good example of why the starting count matters: it represents 14 additional sales.
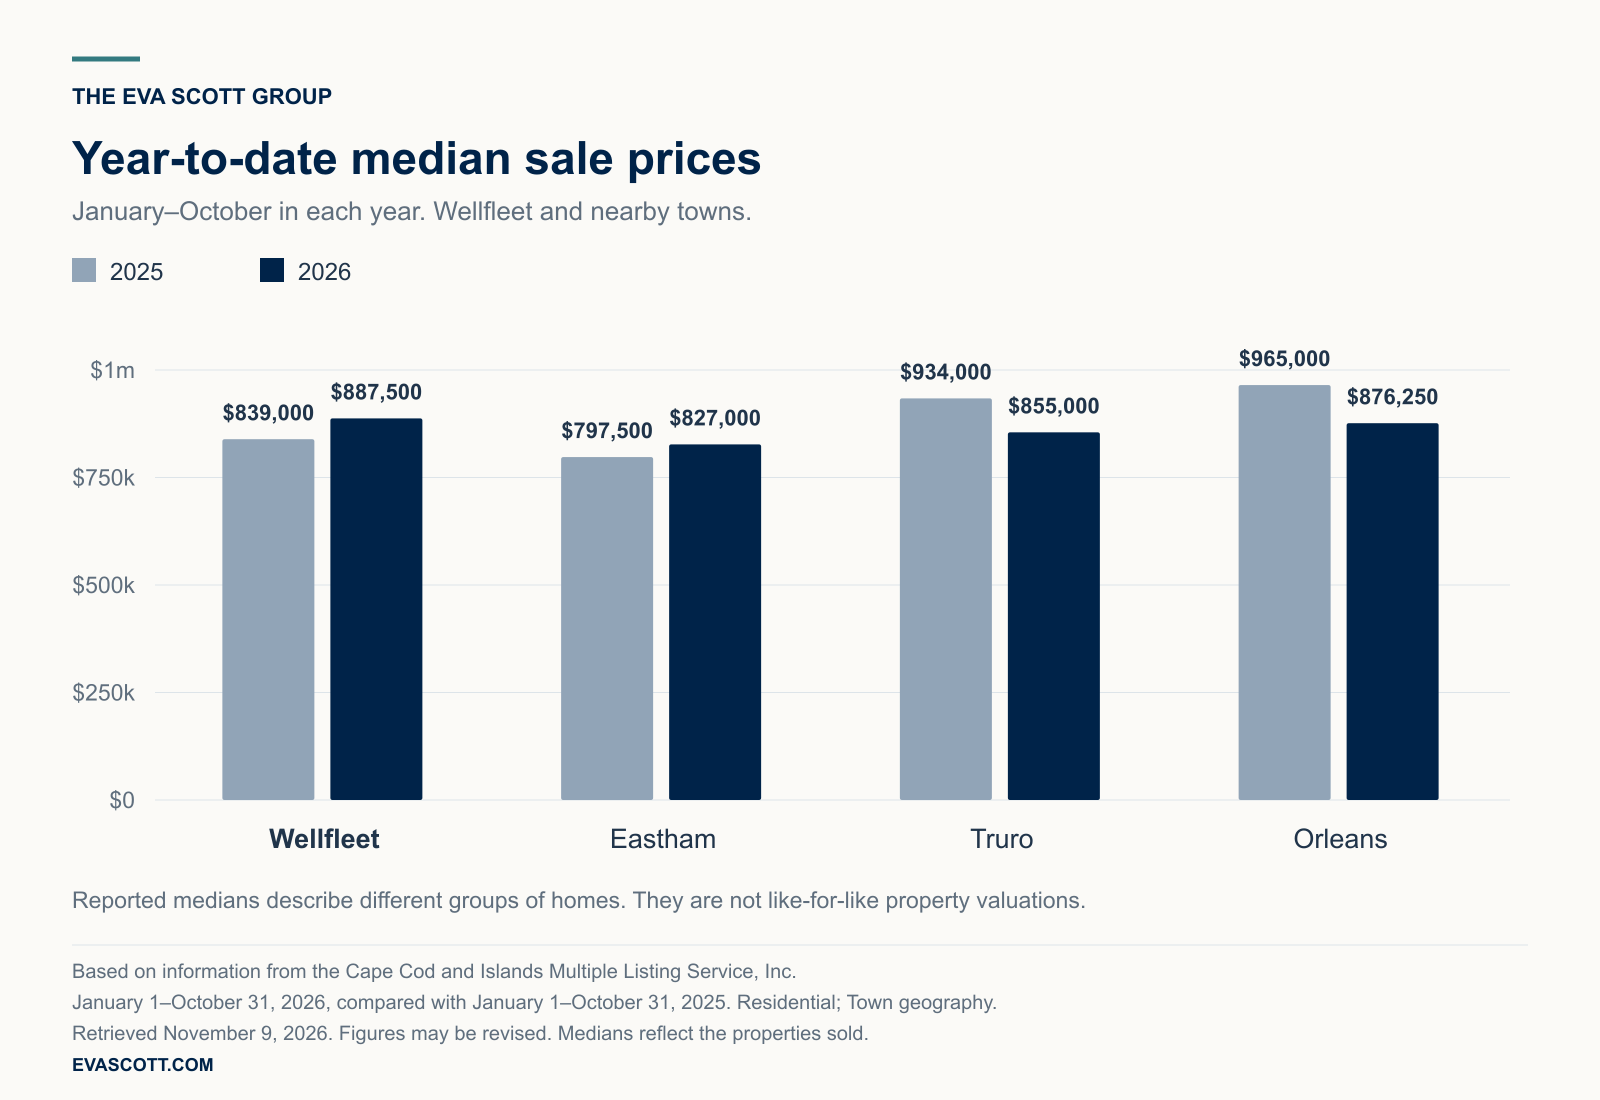
Prices add another twist. Eastham had fewer sales but a higher median, while Truro and Orleans had more sales alongside lower medians. Wellfleet’s median rose 5.8% and Eastham’s rose 3.7%; Truro’s declined 8.5% and Orleans’ declined 9.2%.
For a Wellfleet seller, this is useful context for discussing how the home compares with alternatives nearby. A lower median in another town does not establish the value of a comparable Wellfleet property. The more useful question is what your asking price offers a buyer in terms of location, condition and features, alongside the specific homes they could choose instead.

The seasonal rhythm, in two lines
For a seller, inventory is the backdrop to a practical question: what else could a buyer choose when your home comes to market? One October count offers a snapshot. Following the same months across two years shows how that backdrop changes through the seasons.
In March, Wellfleet had 12 active residential listings, compared with 23 in March 2025. By June, the 2026 count had reached 41, versus 36 a year earlier. The highest count shown for 2025 was 40 in July. By October, the two years were nearly level: 34 active listings in 2026 and 33 in 2025.
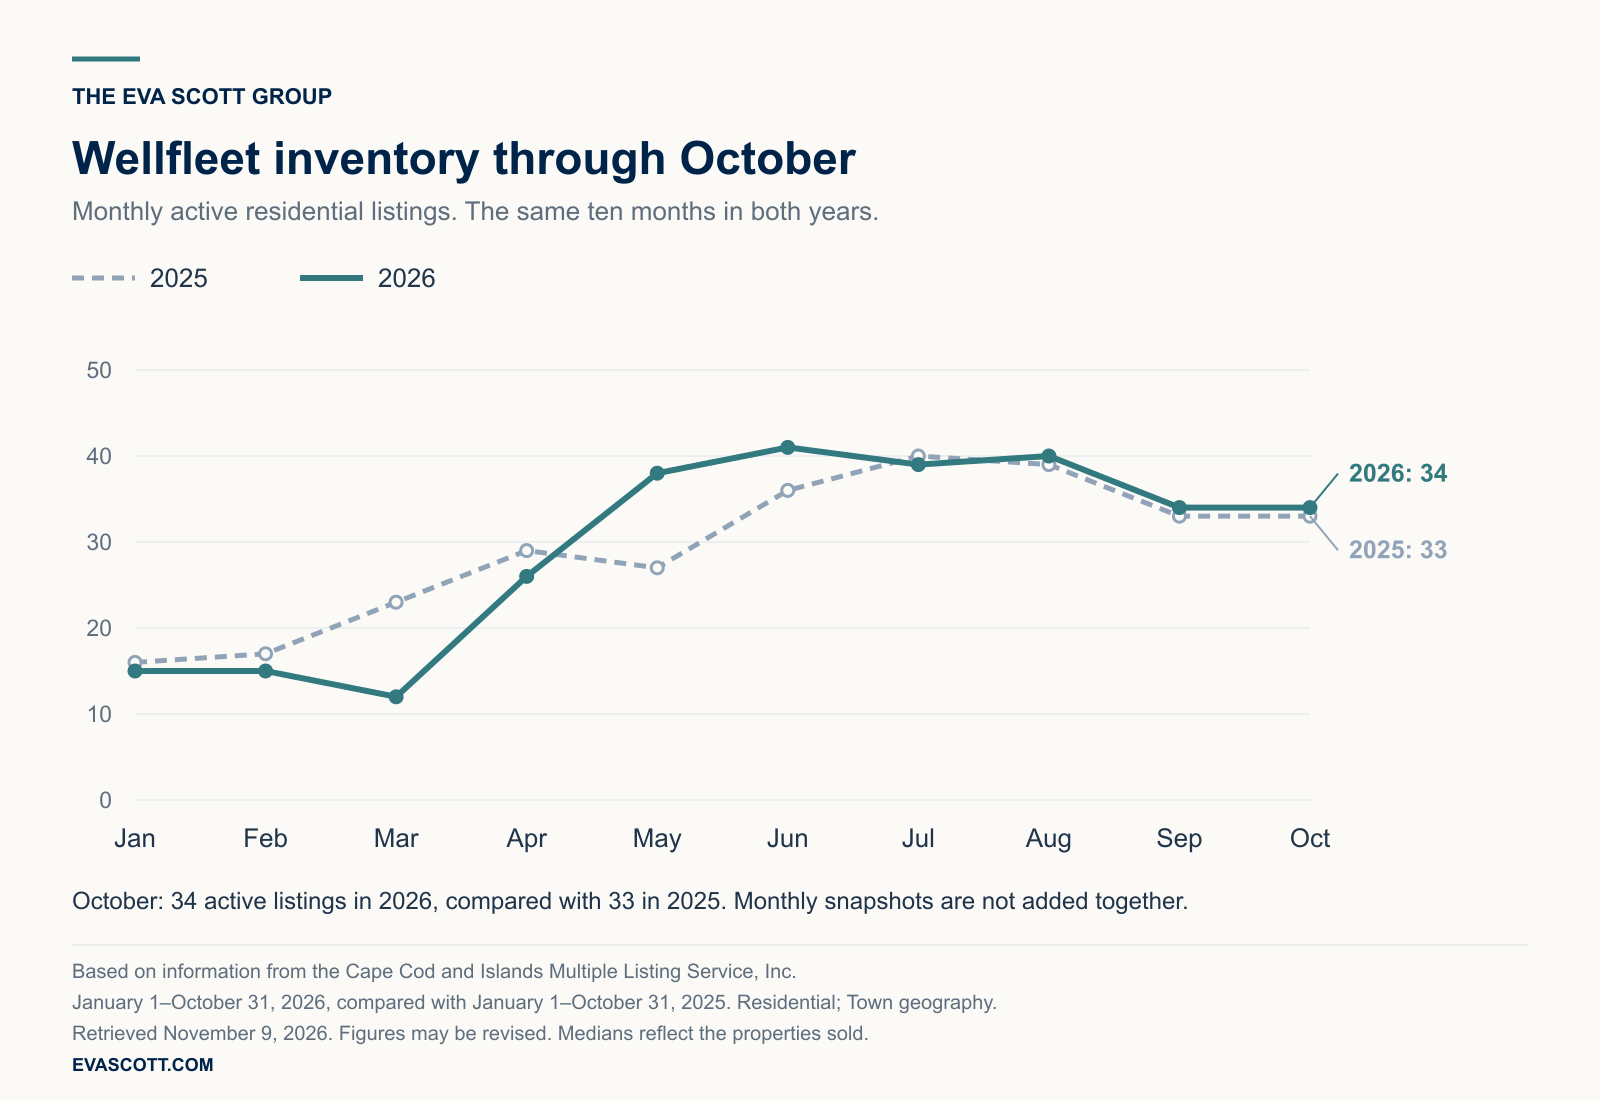
A quieter point in the inventory cycle does not, by itself, identify the best time to sell. Your price range, property type and location determine which listings are the closest competition. Looking at those homes alongside recent closed sales can help you decide how to position your property and what to have ready before it launches.
Bring the picture back to your home
Imagine a buyer arriving for the first showing. What will they notice first? Which details will help them understand the home’s setting and how it lives? That is where preparation and presentation make the market discussion concrete: deciding which repairs to address, how to prepare the rooms, and what the photography and description should bring forward.
A useful selling plan brings three things together: comparable sales to inform the price, current listings to understand the competition, and a preparation schedule that fits your next move. The town-wide numbers give us perspective; your home and your priorities shape the decisions.
If a sale is on your horizon, talk with The Eva Scott Group about your Wellfleet home. We can review the most relevant sales and competing listings with you, then build a pricing, preparation and marketing plan around the property you know so well.
Based on information from the Cape Cod and Islands Multiple Listing Service, Inc. for January 1 through October 31, 2026, with comparisons to January 1 through October 31, 2025. October-only figures cover October 1–31 in each year. Information is deemed reliable but is not guaranteed and may be revised. These are aggregate market statistics, not an appraisal or an estimate of any individual home’s value.
Sources and scope: CCIMLS flexmls Market Summary reports and exports retrieved November 9, 2026. Town reports use the Residential property type and Town geography, with “Include Comp Sale Listings” unchecked. Year-to-date comparisons cover January–October in each year; 2026 is not a completed full year. Both inventory lines use matching monthly active-listing totals. Four-town sales totals sum the reported town counts; medians are reported separately and are not averaged together. Figures may be revised. Price changes reflect the properties sold, not a repeat-sales measure of individual home values. Community photography by Nauset Media: the Blackfish Creek sunset at Old Wharf Point and Uncle Tim’s Bridge are from the Nauset Media Stock Library.


