

Chatham and nearby towns · January–October 2026
In Chatham, a walk through town takes on a different feel as the days shorten and the holiday season approaches. If you are considering a sale, think about how your home welcomes a buyer in late fall, from the front approach to the light inside, and what to prepare before winter. October’s market results give that plan a local starting point.

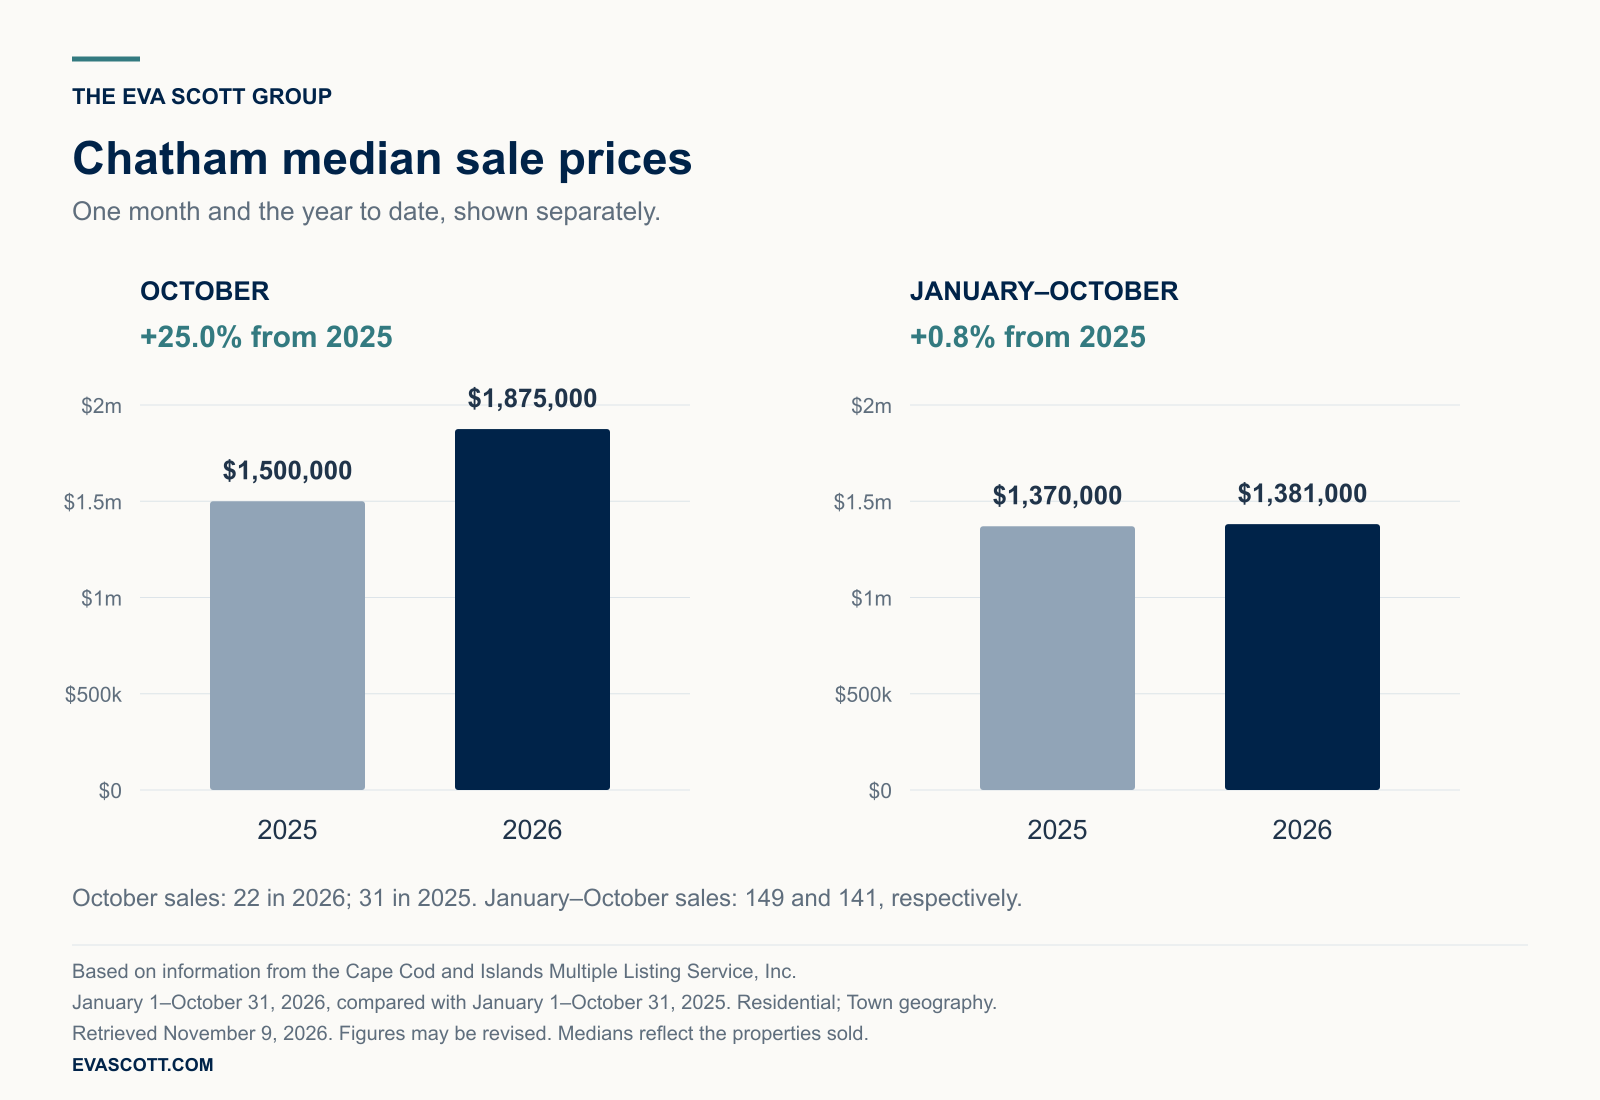
The first ten months of 2026 brought more residential sales than a year earlier, with a median sale price that was nearly steady. October’s much higher median made a more dramatic headline, while the inventory count remained below the prior year.
For sellers, those different views are a reason to look carefully at the time period and the homes behind the numbers. A single high-price month can be informative without becoming a percentage adjustment to apply to your own home.
Put October’s headline beside the full year to date
Chatham recorded 149 residential sales from January through October, compared with 141 in 2025, an increase of 5.7%. The reported median sale price rose 0.8%, from $1,370,000 to $1,381,000.
October was a different picture. Twenty-two homes closed, compared with 31 a year earlier, while the median rose 25.0%, from $1,500,000 to $1,875,000. Fewer closings and a higher median occurred together in that month’s group of sales.
That 25.0% increase does not establish that individual Chatham homes appreciated by a quarter. The month and the year-to-date period contain different sets of transactions. Their medians reflect the homes that sold, including the particular price ranges and property characteristics represented.
For an owner preparing to list, the wider period offers a useful starting point. The next step is a closer review of recent sales that match your property’s setting, condition, size and features. A town median cannot resolve the difference between homes that offer very different locations and ways of living.
Select any chart to view it at full size.
Compare the choices around Chatham
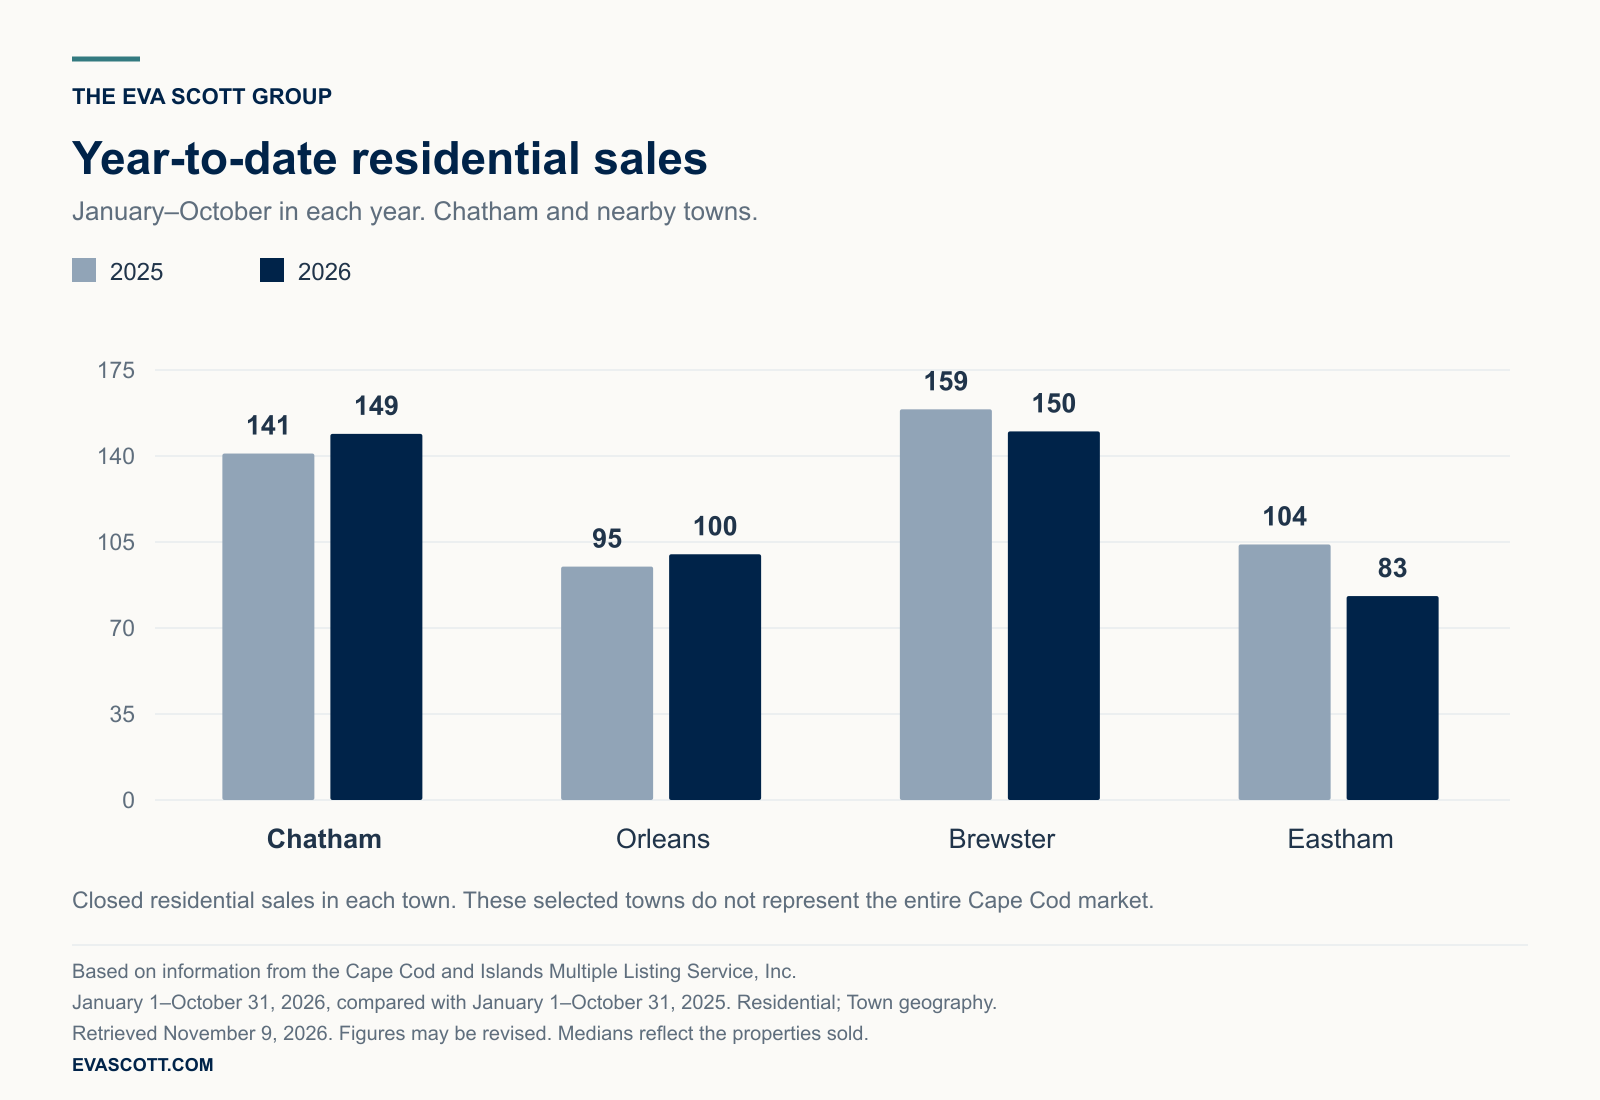
Nearby Orleans, Brewster and Eastham help put Chatham’s results in context. Orleans rose from 95 year-to-date sales to 100. Brewster declined from 159 to 150, while Eastham declined from 104 to 83. Chatham’s count rose from 141 to 149.
These are selected local comparisons, rather than a total for all of Cape Cod. For sellers, they are useful background for thinking about the homes a buyer might consider across town lines. The specific competing properties still need to be reviewed individually.
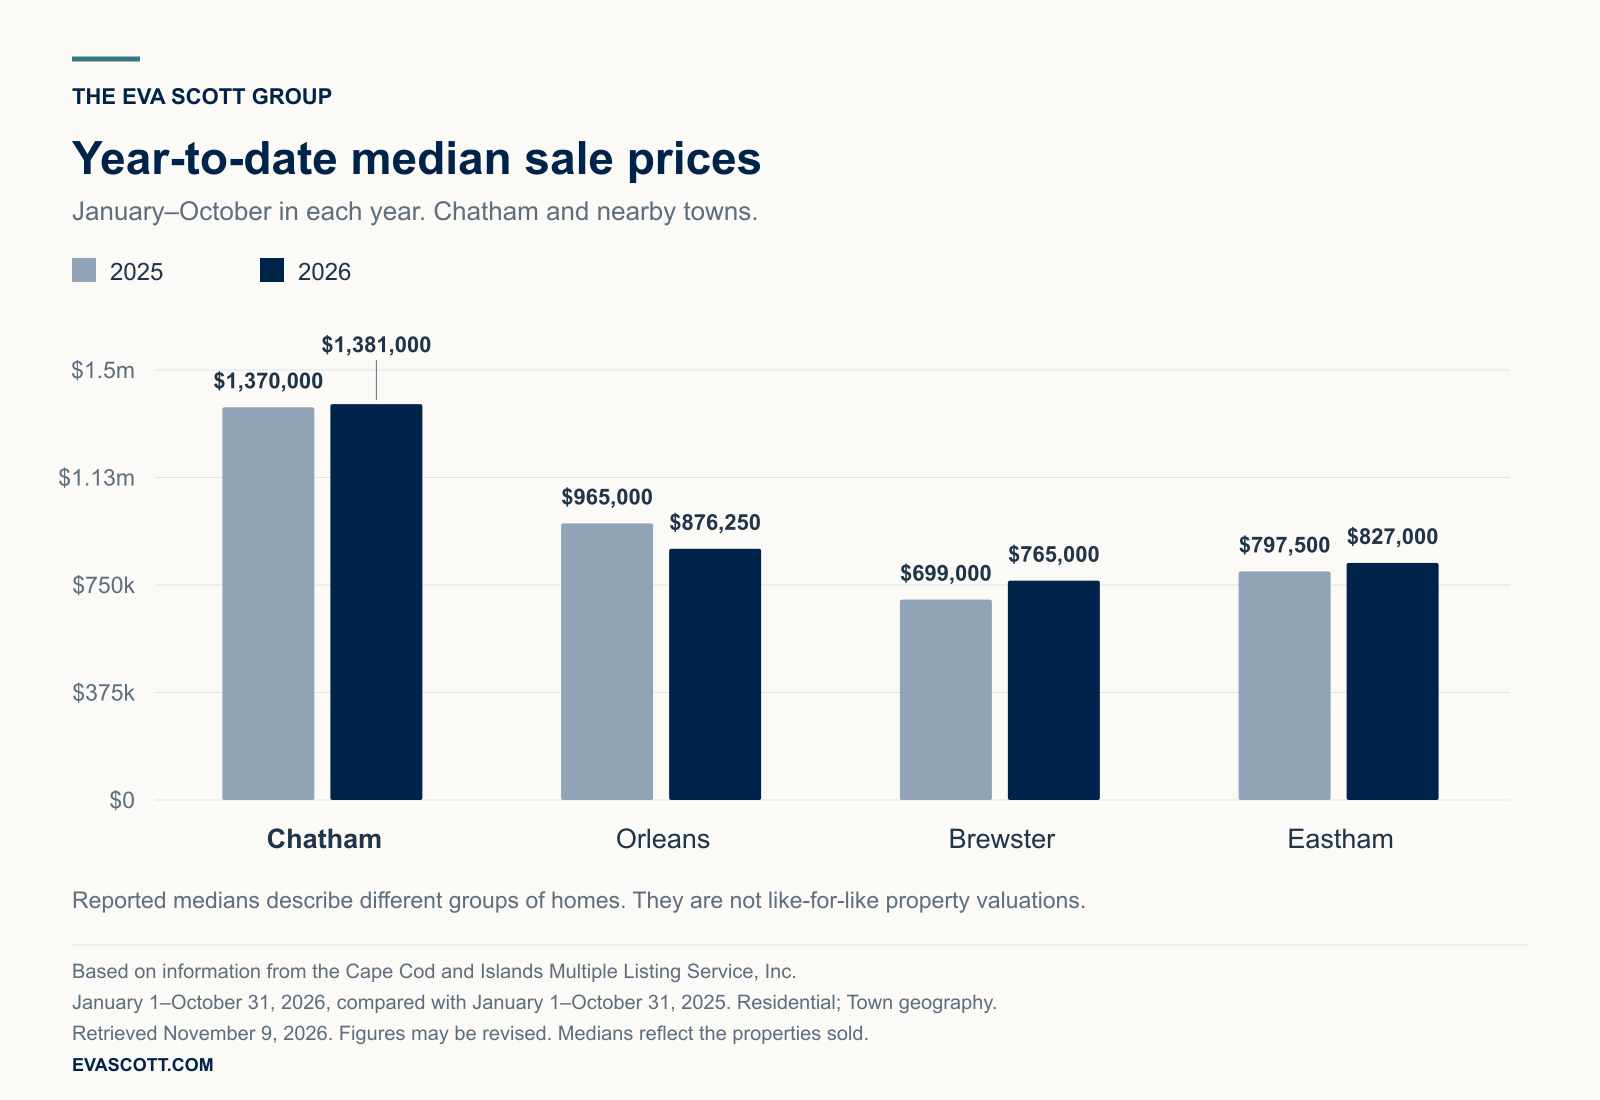
Chatham’s nearly steady year-to-date median of $1,381,000 sat alongside different price trends in the other towns. Brewster rose 9.4% to $765,000, Eastham rose 3.7% to $827,000, and Orleans declined 9.2% to $876,250.
A gap between town medians is not a valuation of the same property in different places. The mix of completed sales matters. A useful pricing discussion compares what your home offers in its own setting with the real alternatives a buyer could choose, rather than treating those medians as interchangeable price tags.

The inventory story, in two years
Chatham’s active-listing count was lower than the matching 2025 count in every month shown from January through October. January began with 30 active listings in 2026, compared with 42 in 2025. February’s counts were 29 and 40, respectively.
The highest 2026 count shown was 58 in May. The 2025 series reached 67 in June. By October, Chatham had 52 active residential listings, compared with 66 a year earlier, a difference of 14 listings, or 21.2%.
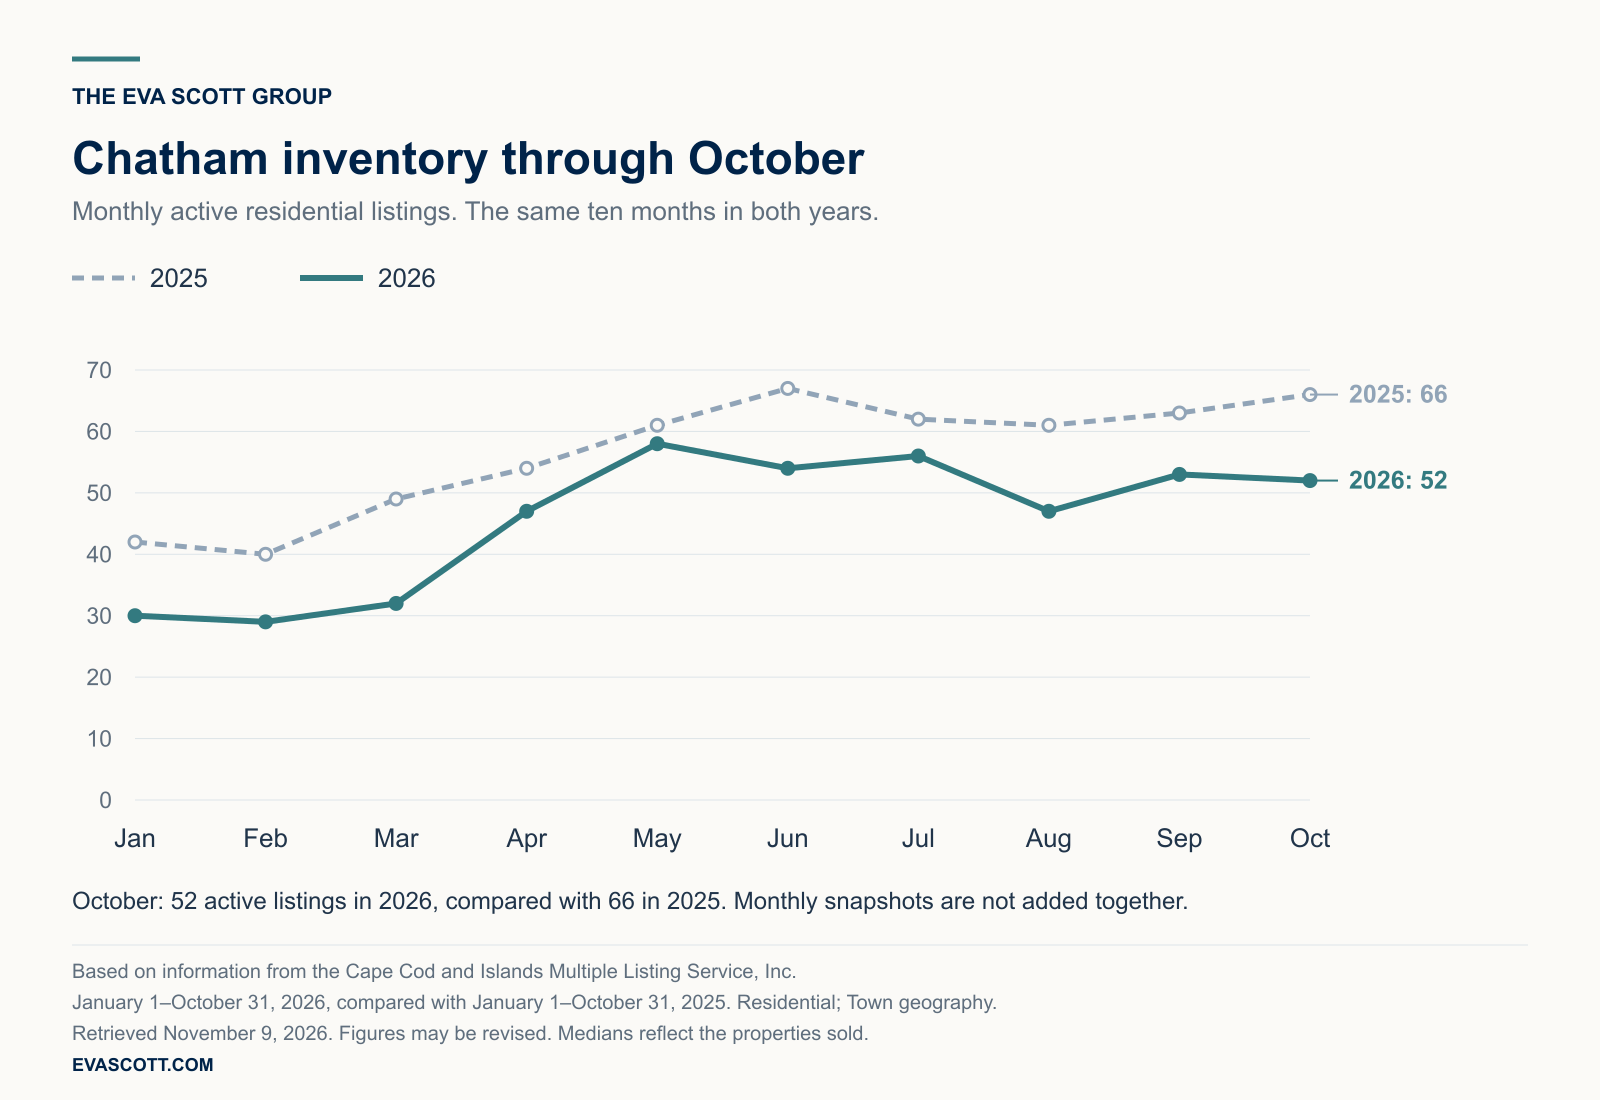
For a seller, a lower town-wide inventory count is a reason to investigate the current alternatives in the property’s own segment. It does not remove the need for careful pricing or presentation. The closest competition may be a small subset of the town total, shaped by price range, condition, location and features.
Give the selling plan a clear point of view
Think about what a buyer should understand before arriving at the property. The photographs can establish the setting and layout, while the description can make the important features clear. Preparation helps the home’s presentation feel consistent from the first image to the first showing.
Then bring the market review back to the practical choices: which completed sales inform the price, which current listings compete most closely, and what needs to be ready before launch. Your next move and preferred timing belong in that plan alongside the numbers. October’s headline is part of the context, not the whole case for an asking price.
If a sale is on your horizon, talk with The Eva Scott Group about your Chatham home. We can review the most relevant sales and current listings with you, then build a pricing, preparation and marketing plan around your property and your next move.
Based on information from the Cape Cod and Islands Multiple Listing Service, Inc. for January 1 through October 31, 2026, with comparisons to January 1 through October 31, 2025. October-only figures cover October 1–31 in each year. Information is deemed reliable but is not guaranteed and may be revised. These are aggregate market statistics, not an appraisal or an estimate of any individual home’s value.
Sources and scope: CCIMLS flexmls Market Summary reports and exports retrieved November 9, 2026. All town reports use the Residential property type and Town geography, with “Include Comp Sale Listings” unchecked. Year-to-date means January–October in each year; 2026 is not a completed full year. Monthly inventory observations are active-listing snapshots and are not added together. Medians are reported separately for each town and period, not averaged from monthly or town medians. Changes in medians reflect the properties sold, not repeat sales of identical homes. Photography by Nauset Media, reused from the site’s Chatham guide.


