

Brewster and nearby towns · January–October 2026
A November walk along Brewster’s bay beaches or pond paths comes with a warmer layer and an eye on the early sunset. For an owner thinking about selling, the weeks before winter are a chance to make a practical plan: which repairs to address, how to present the home in cooler weather and whether to list this fall or use the season to prepare for spring.

This year’s market makes a strong case for looking beyond one month. October had more completed sales than a year earlier and a slightly lower median. Across the first ten months, the pattern was reversed: fewer sales and a higher median.
For an owner weighing a sale, those two views are worth holding together. They help explain why a headline alone is not a selling plan, and why the most relevant recent sales and current competition deserve a closer look.
October and the year tell different stories
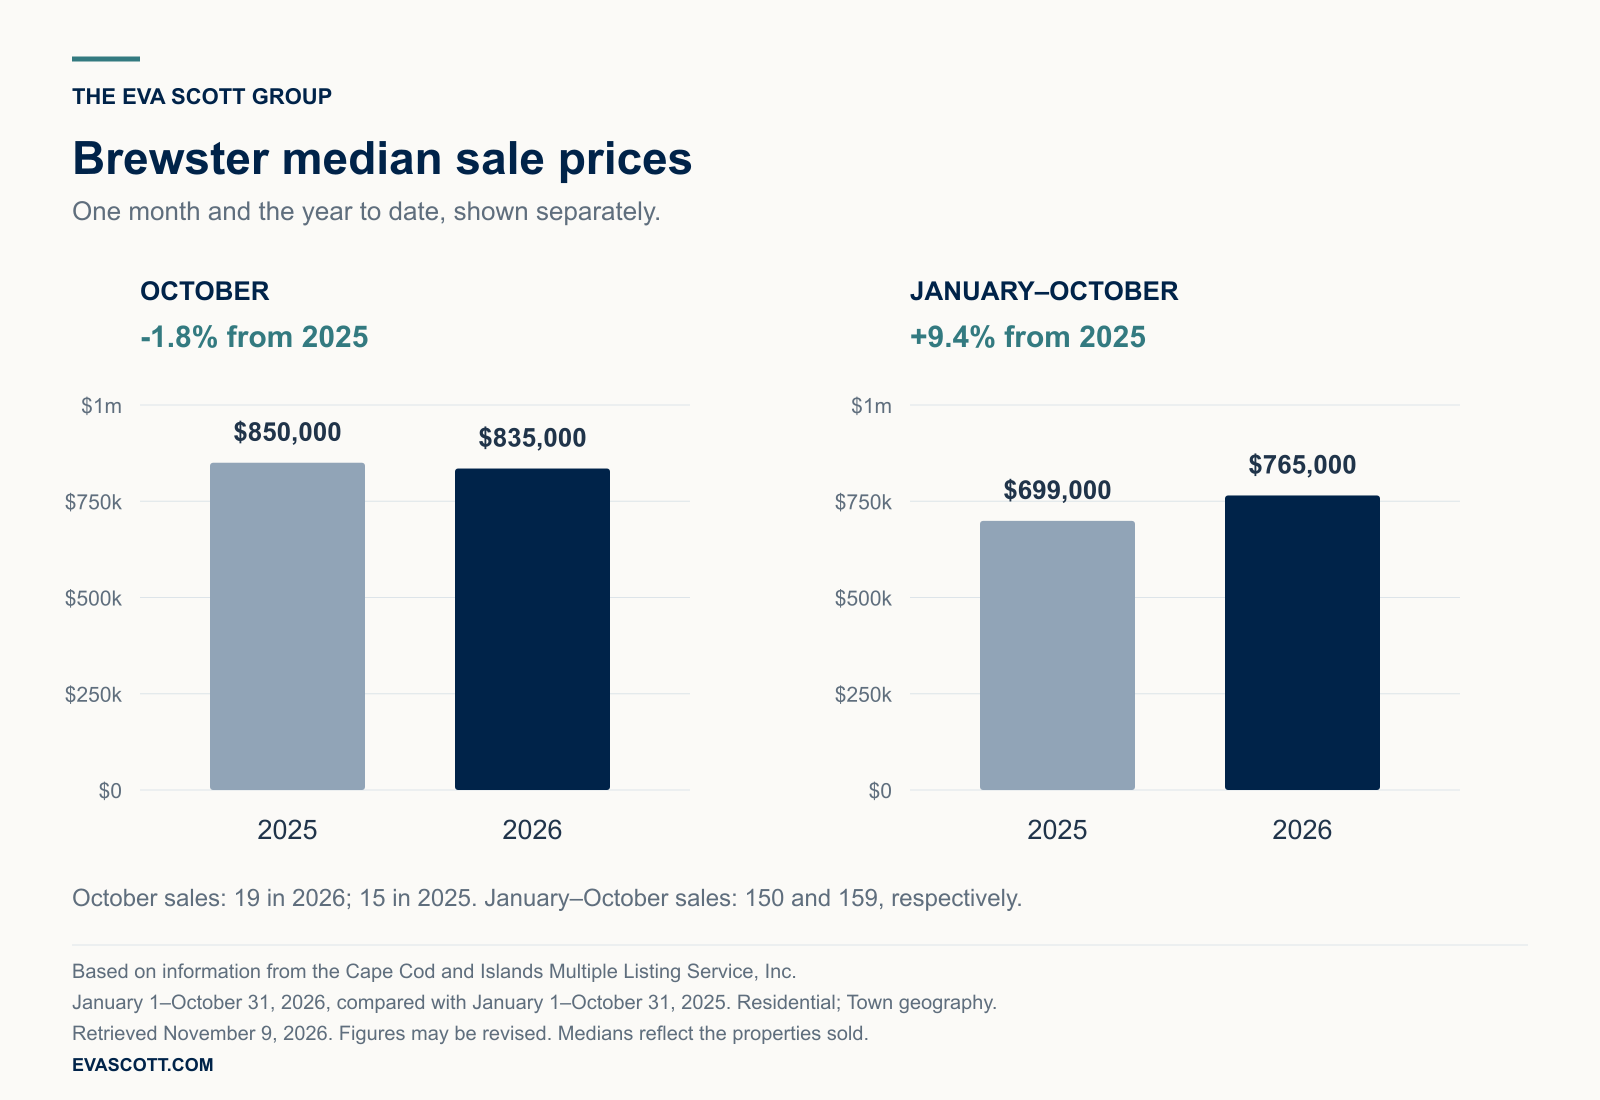
From January through October, Brewster recorded 150 residential sales, compared with 159 in 2025, a decline of 5.7%. The reported median sale price rose 9.4%, from $699,000 to $765,000.
October brought 19 closings, compared with 15 a year earlier, an increase of 26.7%. Its median sale price moved slightly lower, from $850,000 to $835,000, a decline of 1.8%. The month’s median remained above the ten-month median in both years.
Neither view cancels the other. October tells us about one set of completed transactions, while January–October includes a much larger group of homes. Different properties and price ranges can shift the median without measuring a change in the value of an individual home.
If you are setting an asking price, the useful next step is to find the sales that resemble your property. A home near the bay, a pond-side setting and a property with a different layout or condition may call for different comparisons, even when all appear in the same town-wide statistics.
Select any chart to view it at full size.
A wider view of the nearby market
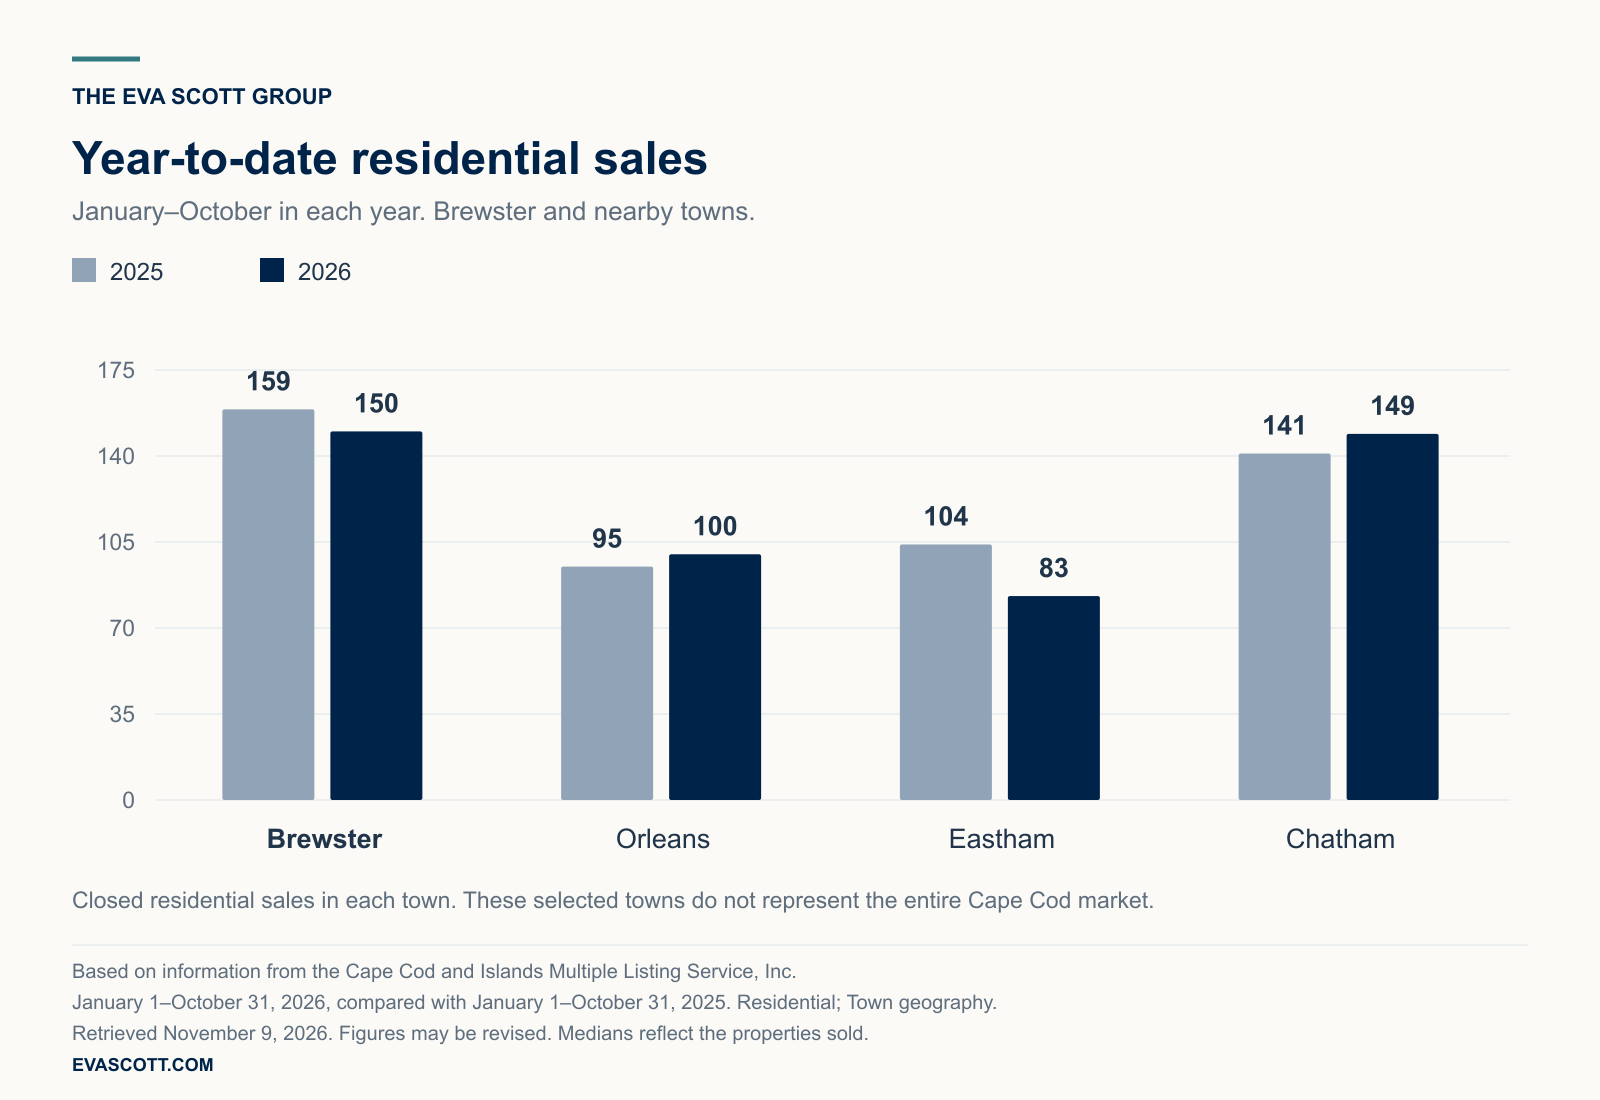
The comparison with Orleans, Eastham and Chatham adds another layer. Orleans’ year-to-date sales rose from 95 to 100, and Chatham’s rose from 141 to 149. Eastham declined from 104 to 83. Brewster’s count fell from 159 to 150.
A buyer may consider homes in more than one of these towns, but the figures show that the local results are not moving together. For sellers, that is a reason to look at the specific competing properties rather than treating the selected towns as one uniform market.
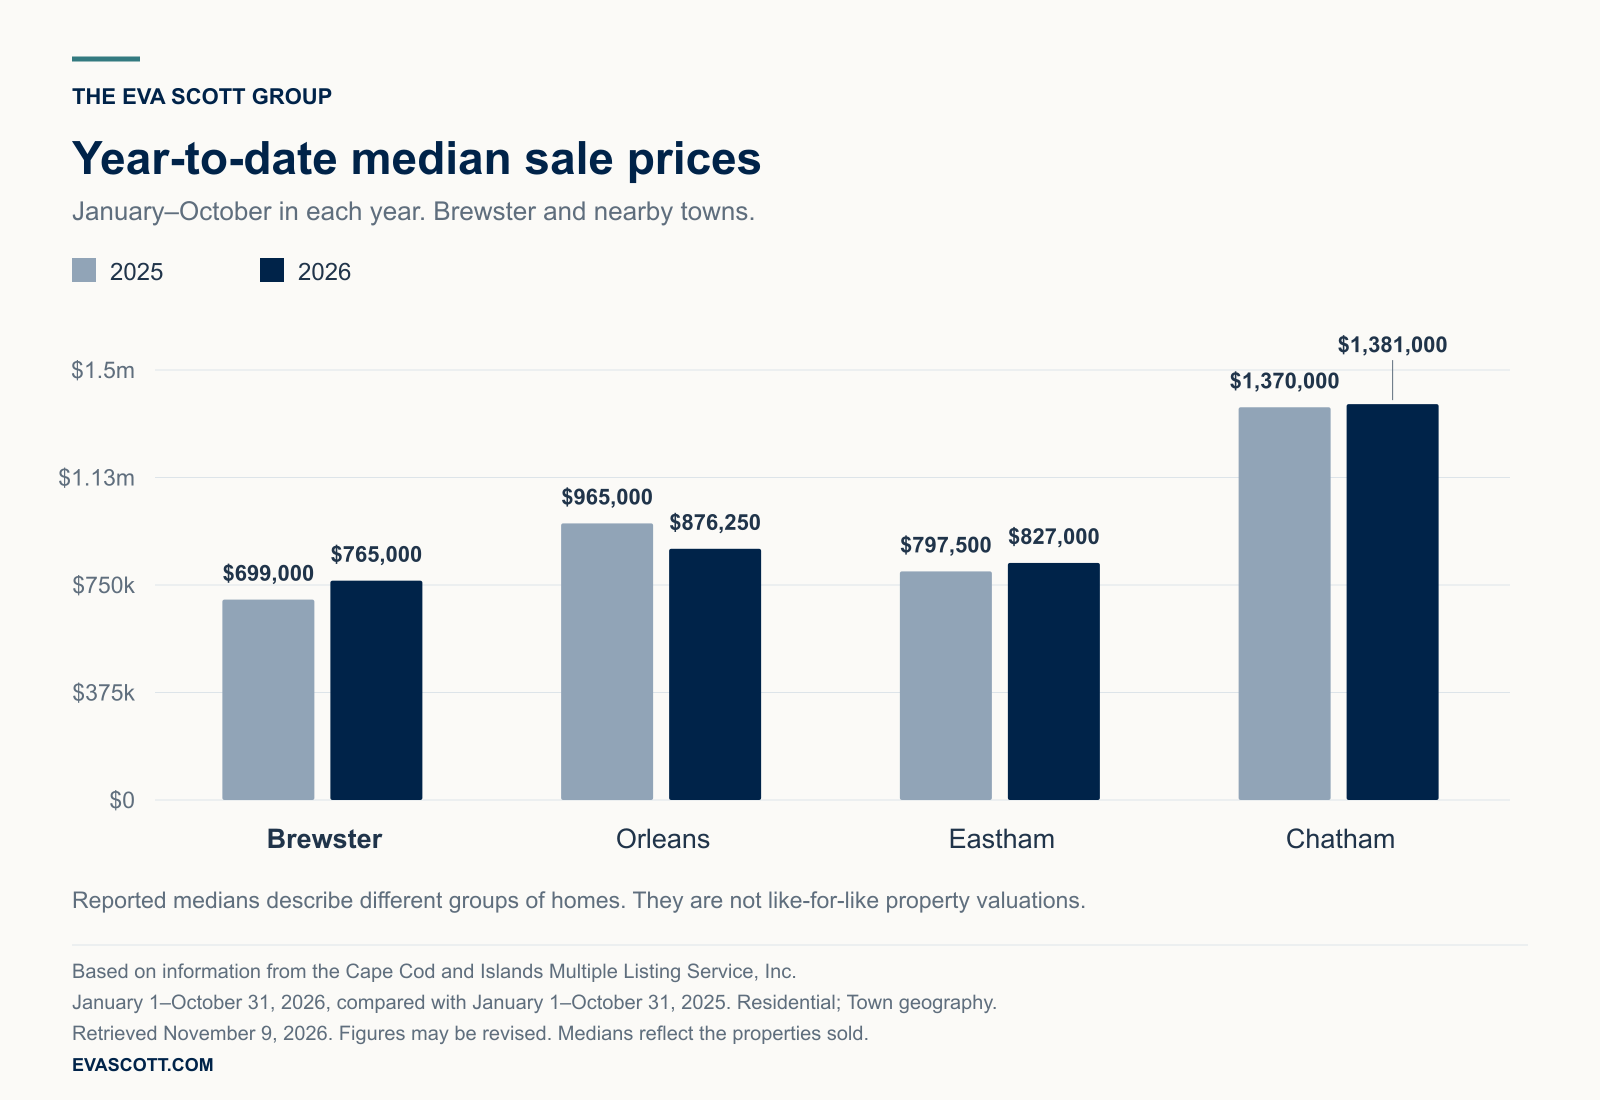
Brewster had the largest percentage increase in the year-to-date median among these four towns, rising 9.4% to $765,000. Eastham rose 3.7% to $827,000, Chatham rose 0.8% to $1,381,000, and Orleans declined 9.2% to $876,250.
Those comparisons describe the groups of homes that sold. They do not tell a buyer or seller what the same home would cost across town lines. Your property’s condition, layout, setting and features need to be evaluated against the actual alternatives that make sense for its price range.

The inventory story, in two years
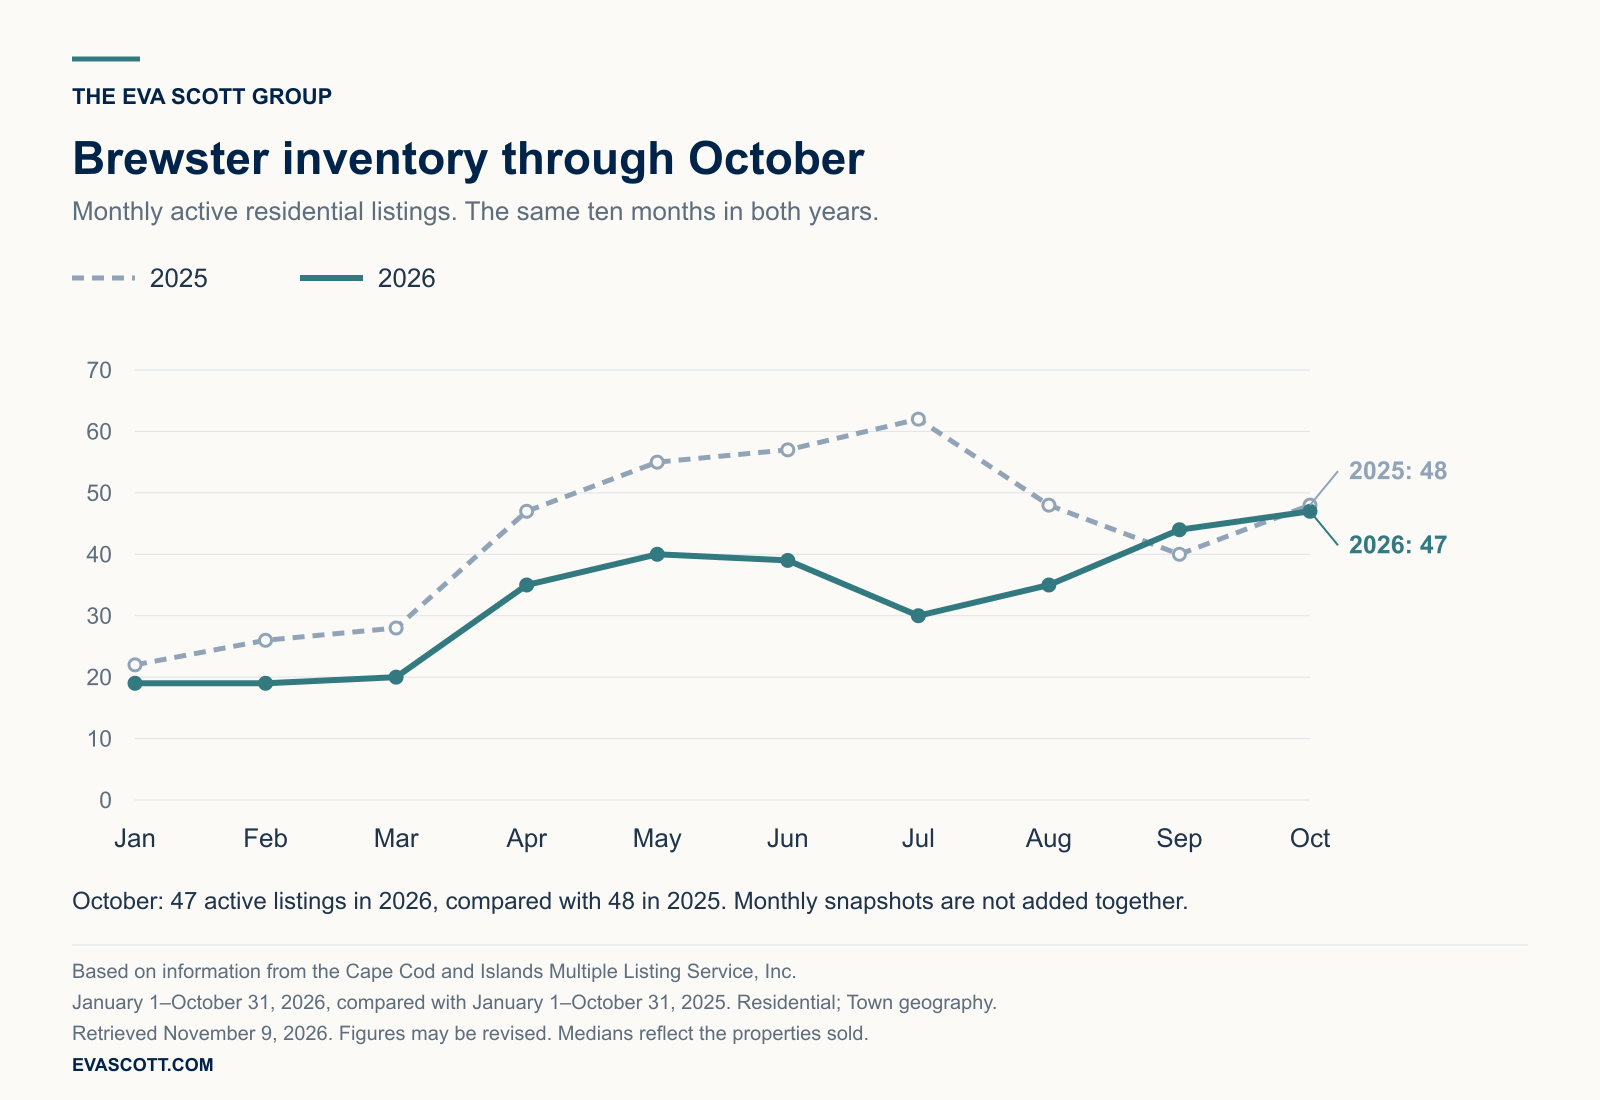
Brewster’s 2026 inventory line stayed below the prior year through much of the first ten months. January began with 19 active listings, compared with 22 a year earlier. By May, the counts were 40 in 2026 and 55 in 2025.
The contrast was particularly clear in July: 30 active listings in 2026, versus 62 in July 2025. Later, the gap narrowed and briefly reversed. September had 44 active listings this year and 40 last year. October finished nearly level at 47 in 2026 and 48 in 2025.
New listings also slowed over the ten-month period, from 227 in 2025 to 196 in 2026. That measures the flow of homes entering the market. The inventory lines show the active stock at monthly snapshots. They answer different questions and should not be added together or treated as the same measure.
Plan the sale around the home you know
For a Brewster seller, the almost equal October inventory counts are a starting point for reviewing the current competition. Which listings share your home’s setting, size and condition? What will a buyer understand from the photographs, and what will become clear only when they visit?
Preparation can then serve a specific purpose: making the home easy to understand and ready to show. Pair that work with a price informed by relevant completed sales and a launch schedule that fits your plans. The year’s higher median is useful context, but the decisions should come back to your property.
If a sale is on your horizon, talk with The Eva Scott Group about your Brewster home. We can review the most relevant sales and current listings with you, then build a pricing, preparation and marketing plan around your property and your next move.
Based on information from the Cape Cod and Islands Multiple Listing Service, Inc. for January 1 through October 31, 2026, with comparisons to January 1 through October 31, 2025. October-only figures cover October 1–31 in each year. Information is deemed reliable but is not guaranteed and may be revised. These are aggregate market statistics, not an appraisal or an estimate of any individual home’s value.
Sources and scope: CCIMLS flexmls Market Summary reports and exports retrieved November 9, 2026. All town reports use the Residential property type and Town geography, with “Include Comp Sale Listings” unchecked. Year-to-date means January–October in each year; 2026 is not a completed full year. Monthly inventory observations are active-listing snapshots and are not added together. Medians are reported separately for each town and period, not averaged from monthly or town medians. Changes in medians reflect the properties sold, not repeat sales of identical homes. Photography by Nauset Media, reused from the site’s Brewster guide.


