

Orleans and nearby towns · January–October 2026
Fall’s earlier sunsets give familiar places like Skaket Beach and Rock Harbor a different light. For an Orleans owner considering a sale, the season also changes the first impression at a showing: the approach to the door, the light in the rooms and the feel of the home on a cool afternoon. Pairing that presentation with the market through October is a useful place to begin.

The first ten months of 2026 brought more completed residential sales than a year earlier, alongside a lower median sale price. October was quieter on closings, and the active-listing count rose into fall while remaining below last October’s.
For sellers, the useful work is to connect those broad changes to the property itself. A village home, a pond-side property and a waterfront setting do not share the same comparisons simply because they share an Orleans address.
A busier year with a lower median
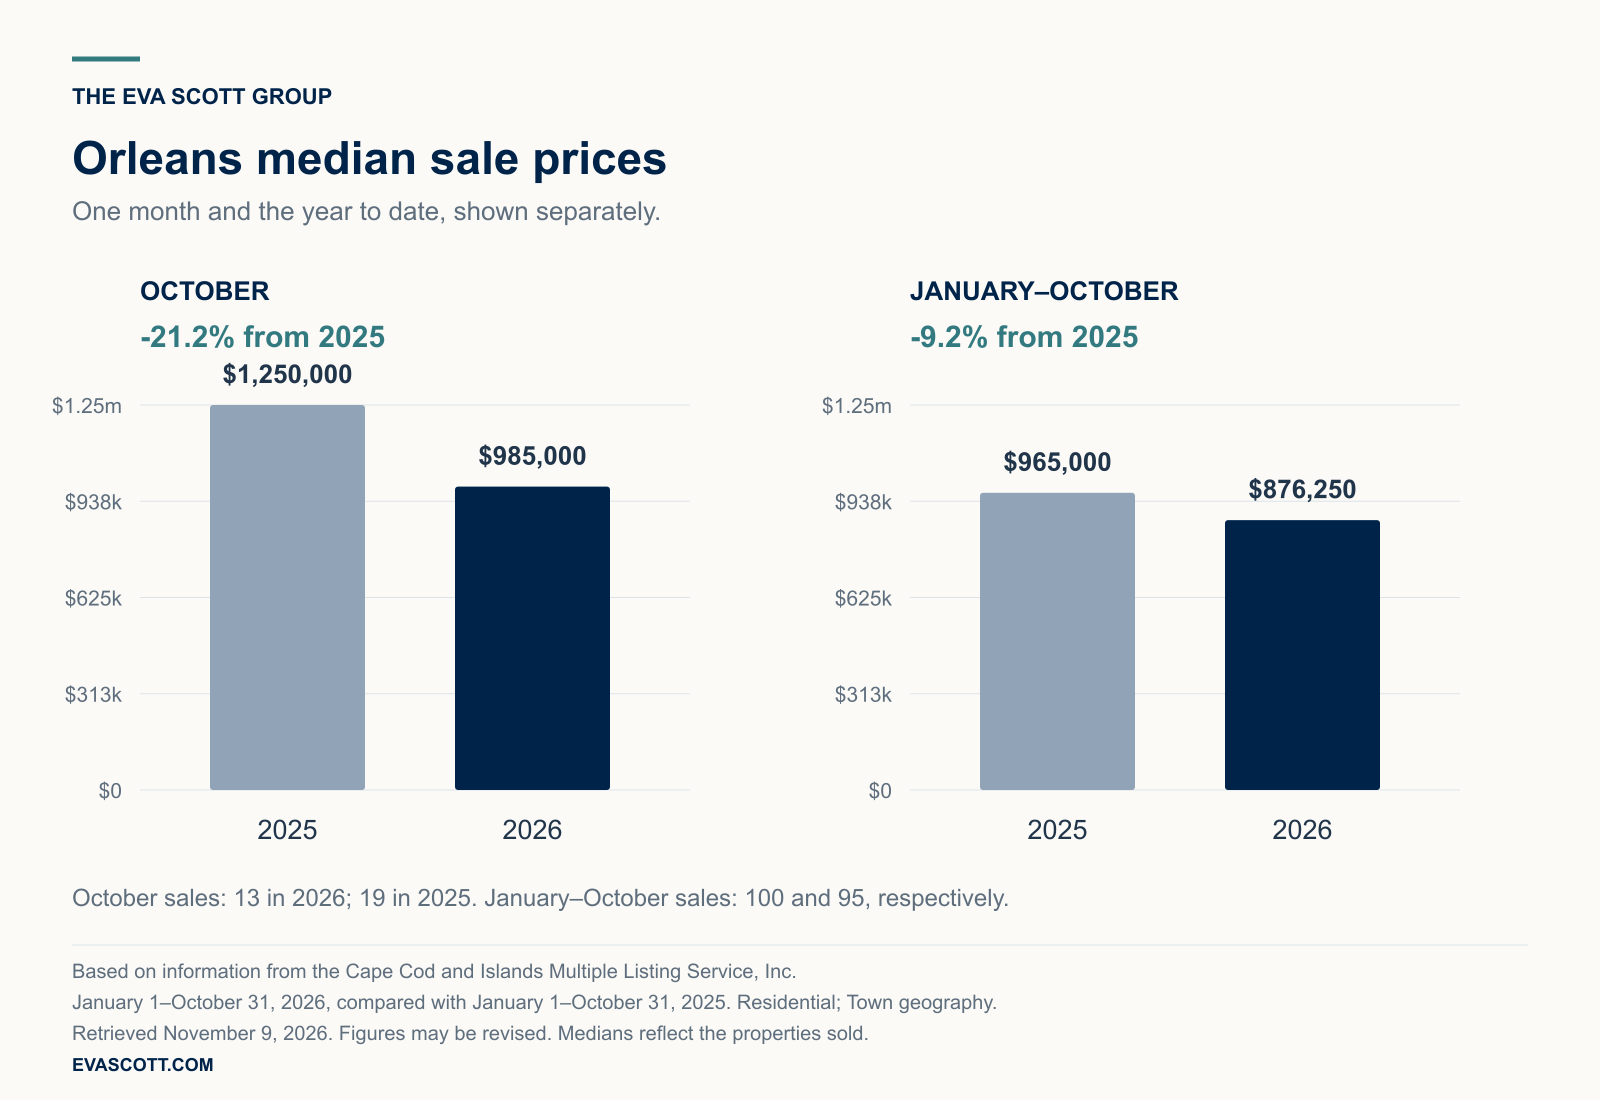
Orleans recorded 100 residential sales from January through October, compared with 95 in 2025, an increase of 5.3%. The reported median sale price declined 9.2%, from $965,000 to $876,250.
In October alone, 13 homes closed, compared with 19 a year earlier. The month’s median was $985,000, down from $1,250,000. This October’s median was still higher than the $876,250 median for the full January–October period, showing how the view changes with the time window.
A median moving lower does not mean that every Orleans home lost 9.2% of its value. These are different sets of transactions. The home types, price ranges and settings represented in them can change, especially when a single month contains only 13 closings.
For a seller, the question is which of those completed sales is useful as a comparison. Recent transactions with similar location, condition, size and features provide a better foundation for an asking price than applying the town’s percentage change directly to your home.
Select any chart to view it at full size.
The market across the next town line
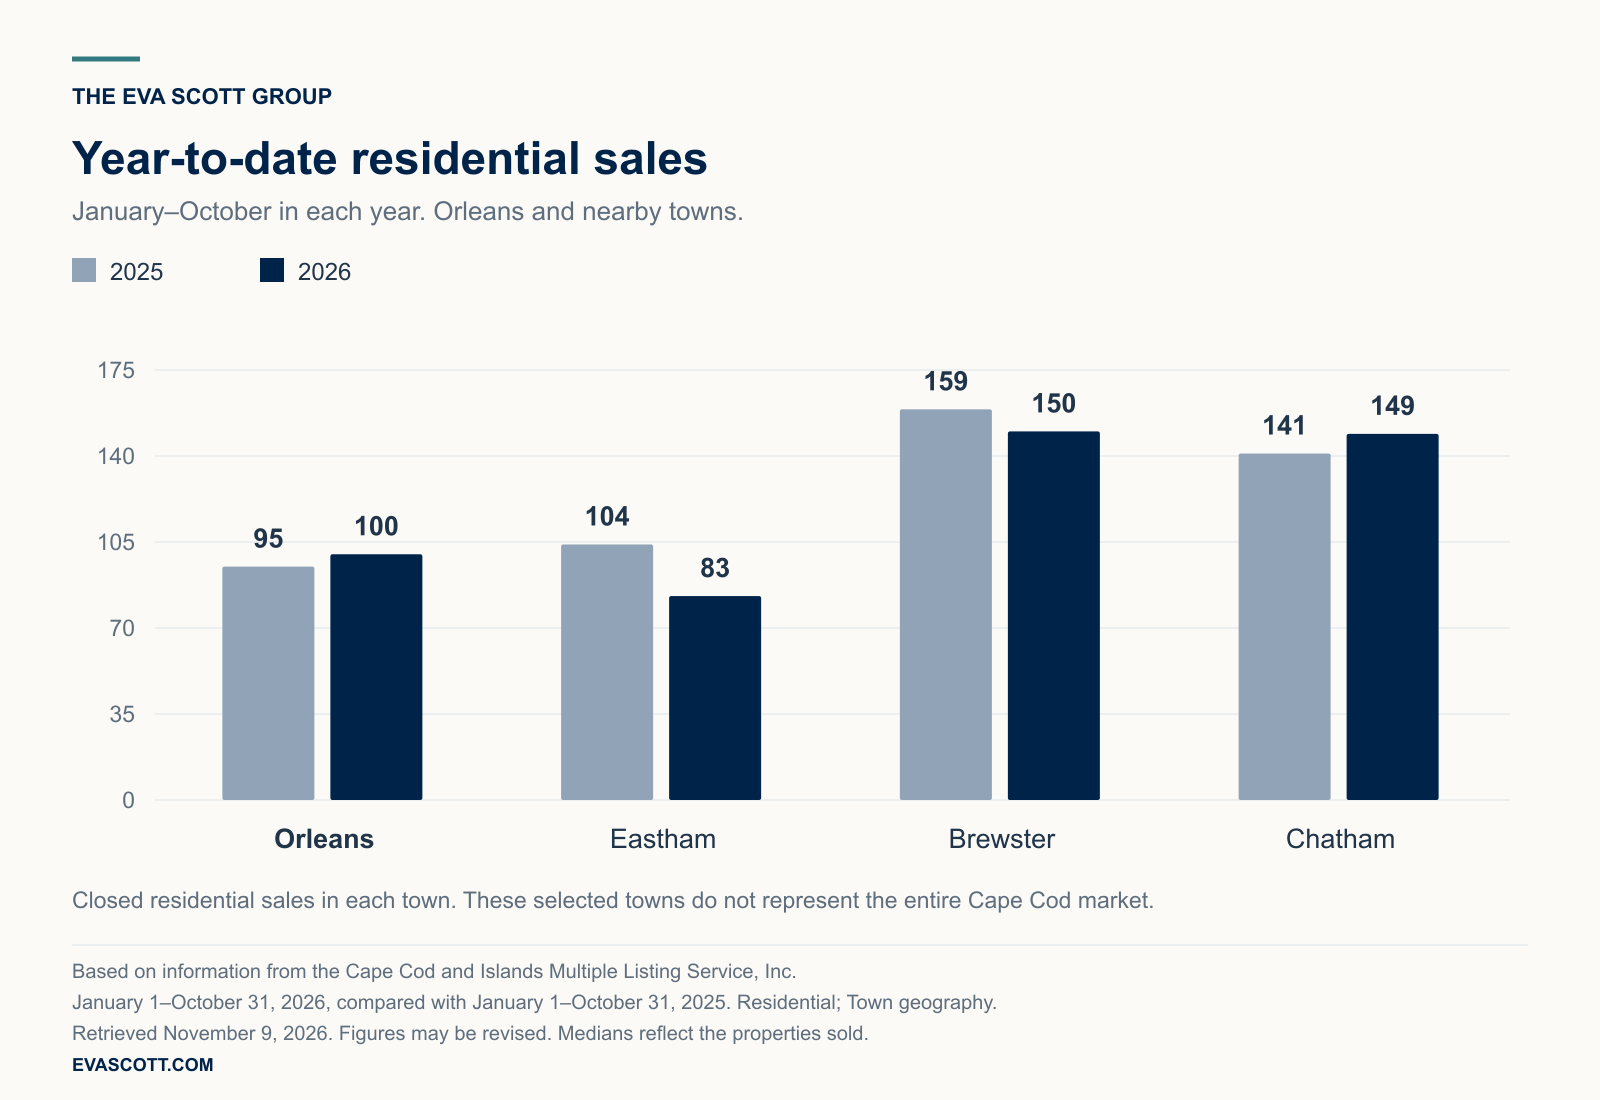
Comparing Eastham, Brewster and Chatham shows why regional headlines need a closer look. Chatham rose from 141 year-to-date sales to 149. Brewster fell from 159 to 150, and Eastham fell from 104 to 83. Orleans’ move from 95 to 100 was its own local result.
For an owner, those counts are useful context for the choices a buyer may be considering across town lines. They do not establish how much interest a particular property will attract, and they do not describe the entire Cape Cod market.
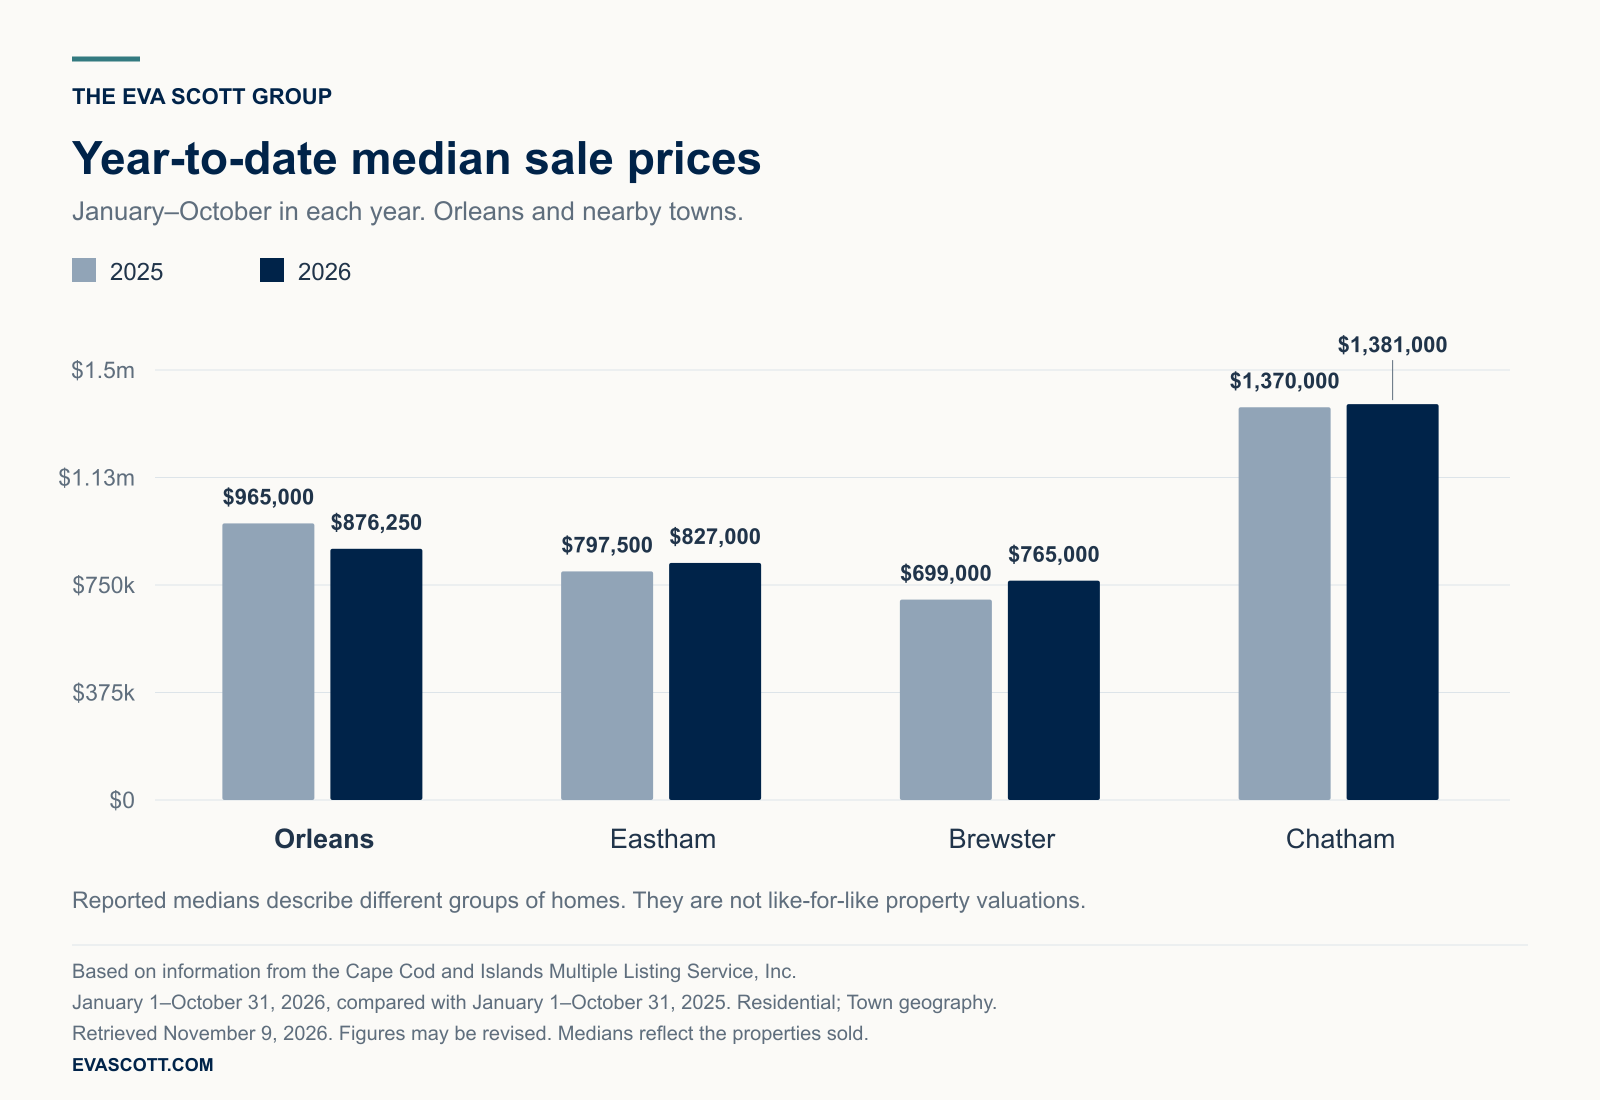
The price comparisons took different paths as well. Eastham’s year-to-date median rose 3.7% to $827,000, and Brewster’s rose 9.4% to $765,000. Chatham’s was nearly steady, rising 0.8% to $1,381,000. Orleans’ median declined to $876,250.
Those are medians of the homes that sold, rather than prices for interchangeable properties. For your selling plan, compare the specific homes that could sit alongside yours on a buyer’s shortlist. The way the property lives, its condition and its relationship to the water or village can matter far more than a broad cross-town price gap.

The inventory story, in two years
Orleans began January 2026 with 43 active listings, compared with 31 in January 2025. By April, the relationship had reversed: 36 active listings in 2026, versus 43 a year earlier. June’s counts were 33 and 54, respectively.
Inventory then rose later in 2026, from 39 in September to 51 in October. October was the highest 2026 count shown in this ten-month series. It was still below October 2025’s count of 60, leaving nine fewer active listings in the town-wide comparison.
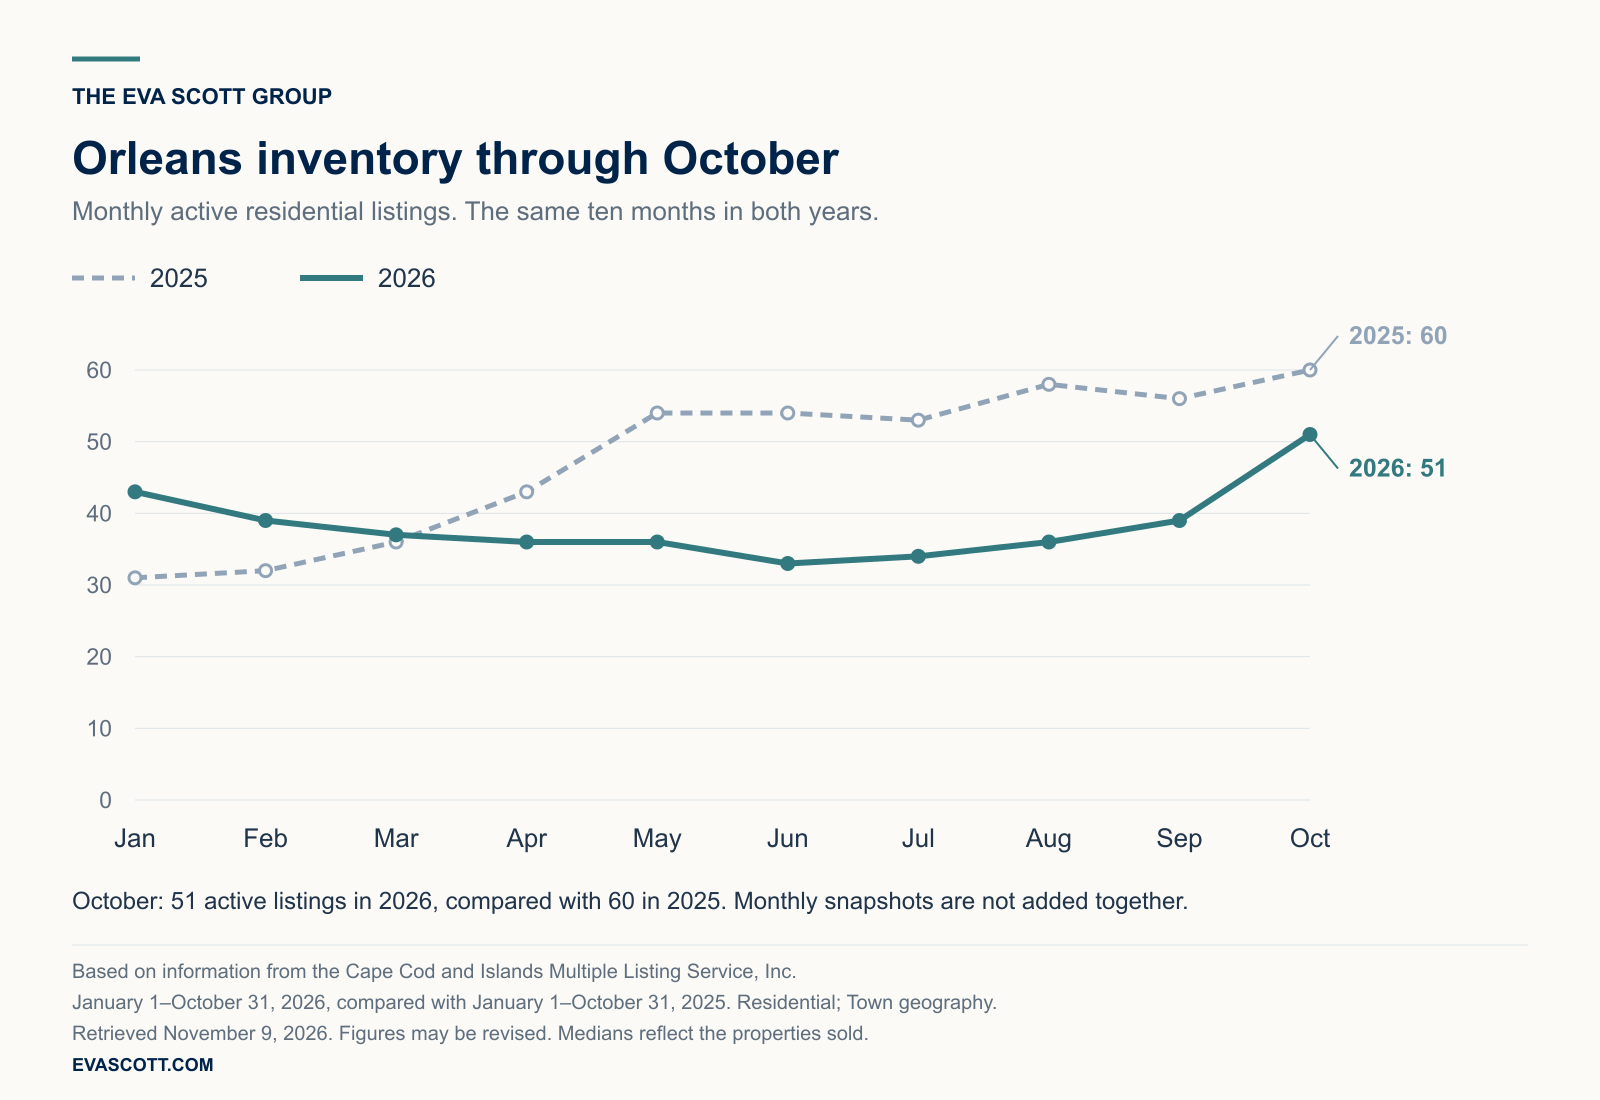
For sellers, both parts of that story matter. October offered more active choices than September this year, even though the count remained below the prior October. The next step is to look within the town total at the listings closest to your home’s price range, location and property type.
Translate the town numbers into a property plan
Imagine the first showing and the questions a buyer will bring with them. What does the layout make possible? Which parts of the setting are best understood in person, and which need to come through in the photographs? Clear presentation gives those questions a useful starting point before someone arrives.
The pricing work should be just as specific. Put the closest completed sales beside the homes currently available, decide which preparation to address before launch and build a schedule around your next move. A market report gives perspective; the plan should be about the Orleans property you are actually selling.
If a sale is on your horizon, talk with The Eva Scott Group about your Orleans home. We can review the most relevant sales and current listings with you, then build a pricing, preparation and marketing plan around your property and your next move.
Based on information from the Cape Cod and Islands Multiple Listing Service, Inc. for January 1 through October 31, 2026, with comparisons to January 1 through October 31, 2025. October-only figures cover October 1–31 in each year. Information is deemed reliable but is not guaranteed and may be revised. These are aggregate market statistics, not an appraisal or an estimate of any individual home’s value.
Sources and scope: CCIMLS flexmls Market Summary reports and exports retrieved November 9, 2026. All town reports use the Residential property type and Town geography, with “Include Comp Sale Listings” unchecked. Year-to-date means January–October in each year; 2026 is not a completed full year. Monthly inventory observations are active-listing snapshots and are not added together. Medians are reported separately for each town and period, not averaged from monthly or town medians. Changes in medians reflect the properties sold, not repeat sales of identical homes. Photography by Nauset Media, reused from the site’s Orleans guide.


